Meet Sage
Sage is the chat at the center of Petavue. It's where you ask questions of your data, dig into what you have, and turn the answers into dashboards, reports, and exports, all in plain language.
It isn't a general-purpose assistant with a data feature bolted on. Sage is Petavue's own model harness, built for one job: analytics on your data from various sources. You can come to it with a clear question, or with no plan at all, to explore what's there and work out what's worth asking. From there you can take it as far as you want: a quick answer, a CSV, a report, or a full publishable dashboard. What makes that possible is its reach, asking any question of any source and getting a real answer, across channels and systems that don't normally talk to each other. That's the thing most tools can't do, and it's what the rest of Sage is built around.
Talk to Your Data
One of the most common things people do with Sage is ad-hoc analysis: ask a question, get an answer grounded in your actual data, no matter which sources it has to reach across to find it.
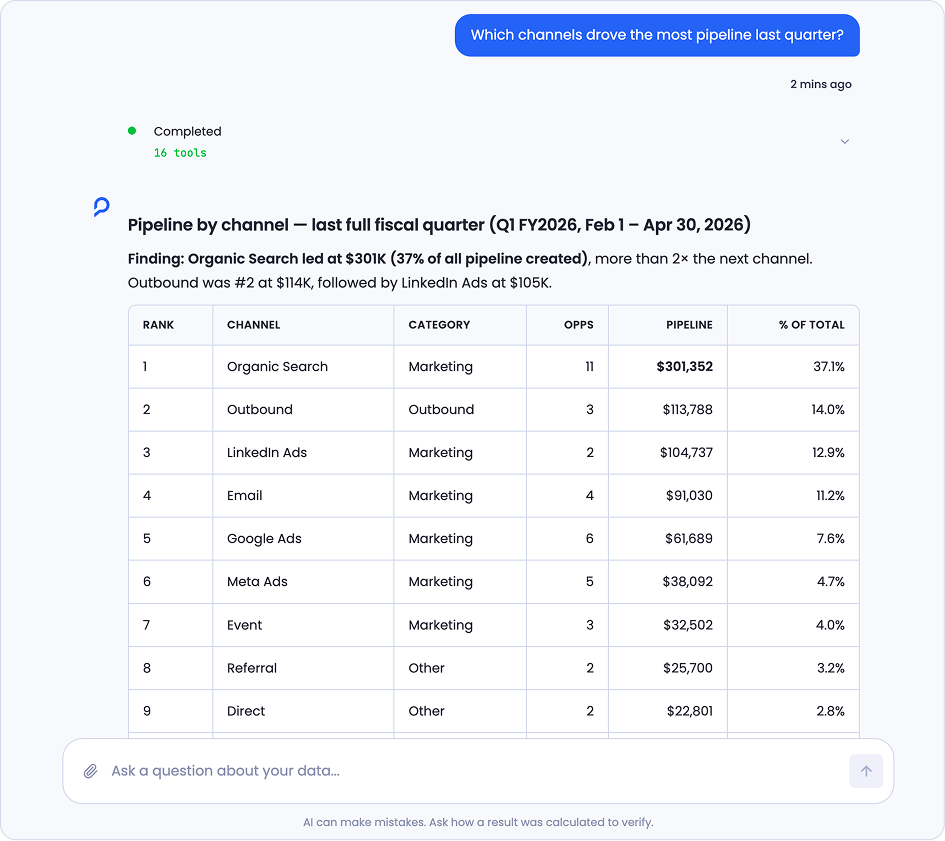
Ask it the way you'd ask an analyst. "Which channels drove the most pipeline last quarter?" "How does this month's cost per lead compare to last?" "Where are deals stalling in the funnel?" Behind the scenes, Sage works through a set of tools to answer. It has tools for reading your files, writing and editing them, running queries, and executing code, and it decides which to use and in what order for the question at hand. You don't manage any of this, but it's why Sage can handle a real analysis rather than just look something up: it's assembling the answer step by step, not pulling it from a single place. The questions that usually mean exporting from three tools and reconciling them in a spreadsheet, like following traffic through to leads and on to closed revenue, are the ones it can answer in a sentence.
It also goes further than a lookup. It'll notice when a question is ambiguous and ask which source you meant, and it'll tell you what a number implies rather than just reporting it. Nothing is hard-coded, and you can always ask how a figure was calculated and see the query behind it.
Watch It Work
Sage doesn't hand you a number from a black box. It shows what it's doing as it goes.
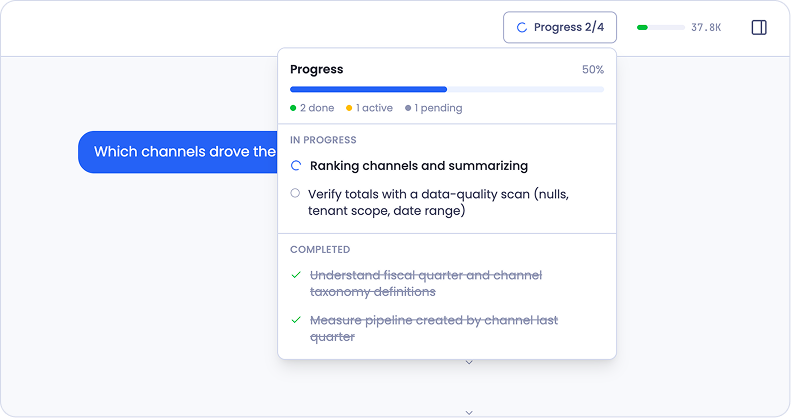
For anything beyond a quick lookup, it breaks the work into a short plan and tracks it in a Progress panel, marking each step done, active, or pending, so you can see it move from "understand the fiscal quarter" through "measure the pipeline" to "verify the totals." Underneath, it shows the actual steps it ran, reading your files and querying your data, so the work is inspectable rather than hidden.
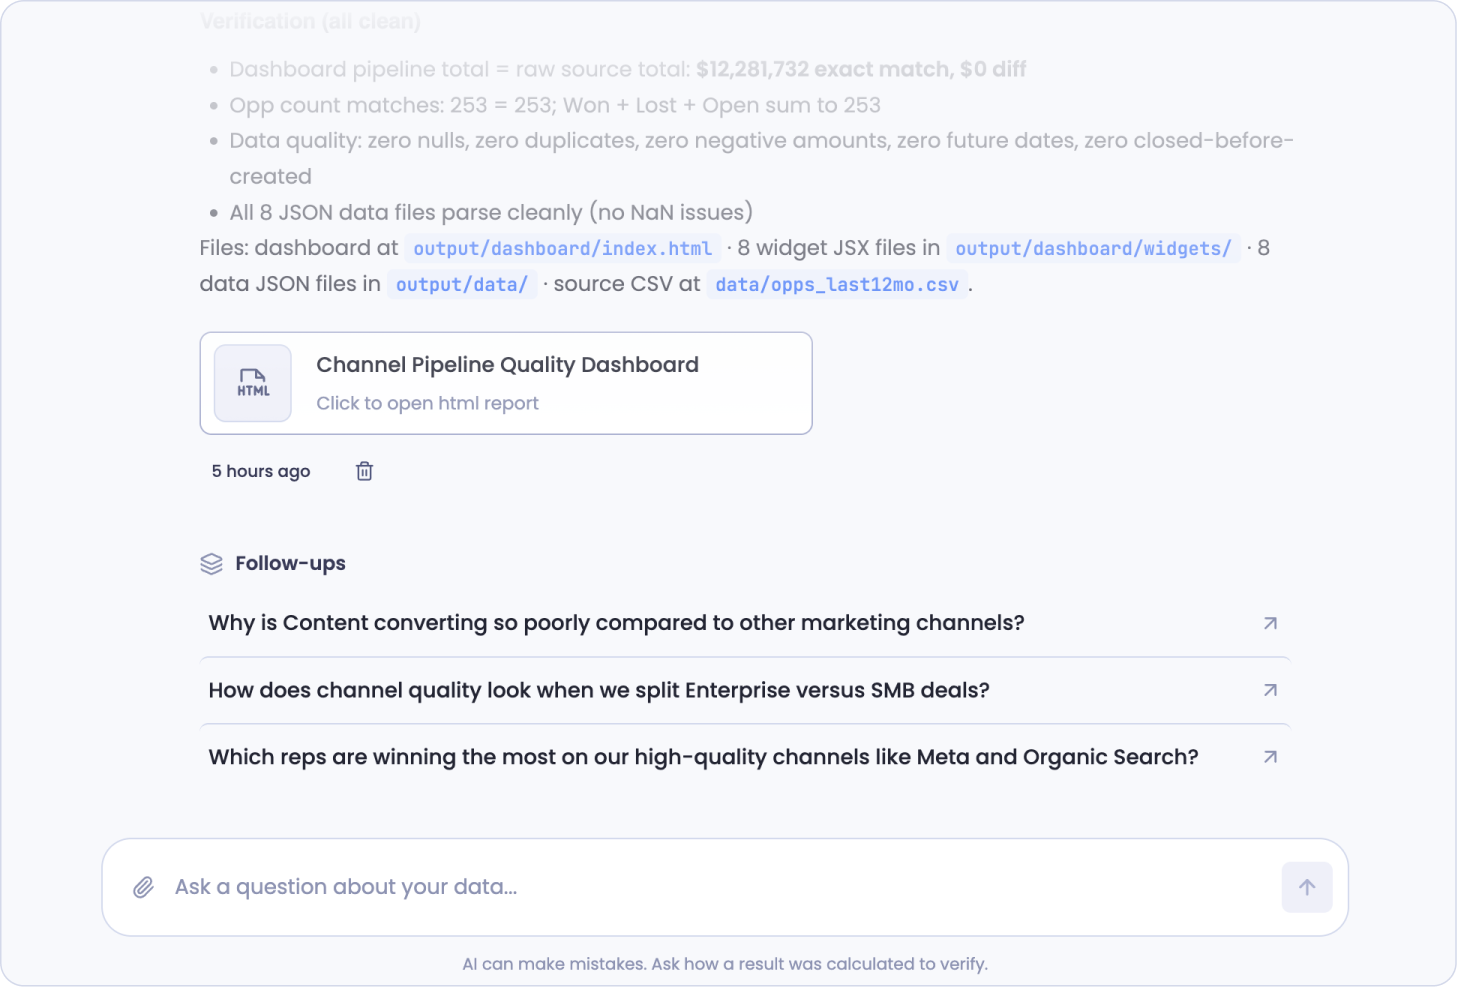
For anything you'd act on, it verifies before it hands it over. When Sage builds a dashboard, it cross-checks the result against the raw source, confirms the totals match to the dollar, and runs data-quality checks for nulls, duplicates, and bad dates, then tells you the outcome. You get the number and the evidence that it holds up.
At the end, it often suggests follow-up questions, the natural next cuts of what you just asked, so a single question tends to open the next one.
Long Sessions Keep Going
A single session holds a lot, but not an unlimited amount. Sage works within a token budget, the room it has to keep the whole conversation in mind at once, and a long, data-heavy session can fill it.
You can see where you stand. A meter in the top right of the chat shows how much of the budget you've used, green when there's plenty of room, yellow as it fills, and red when it's nearly full. As you get close, a line above the message box tells you plainly, for example "Almost full, 142.4k of 175k tokens. Compaction will start soon."
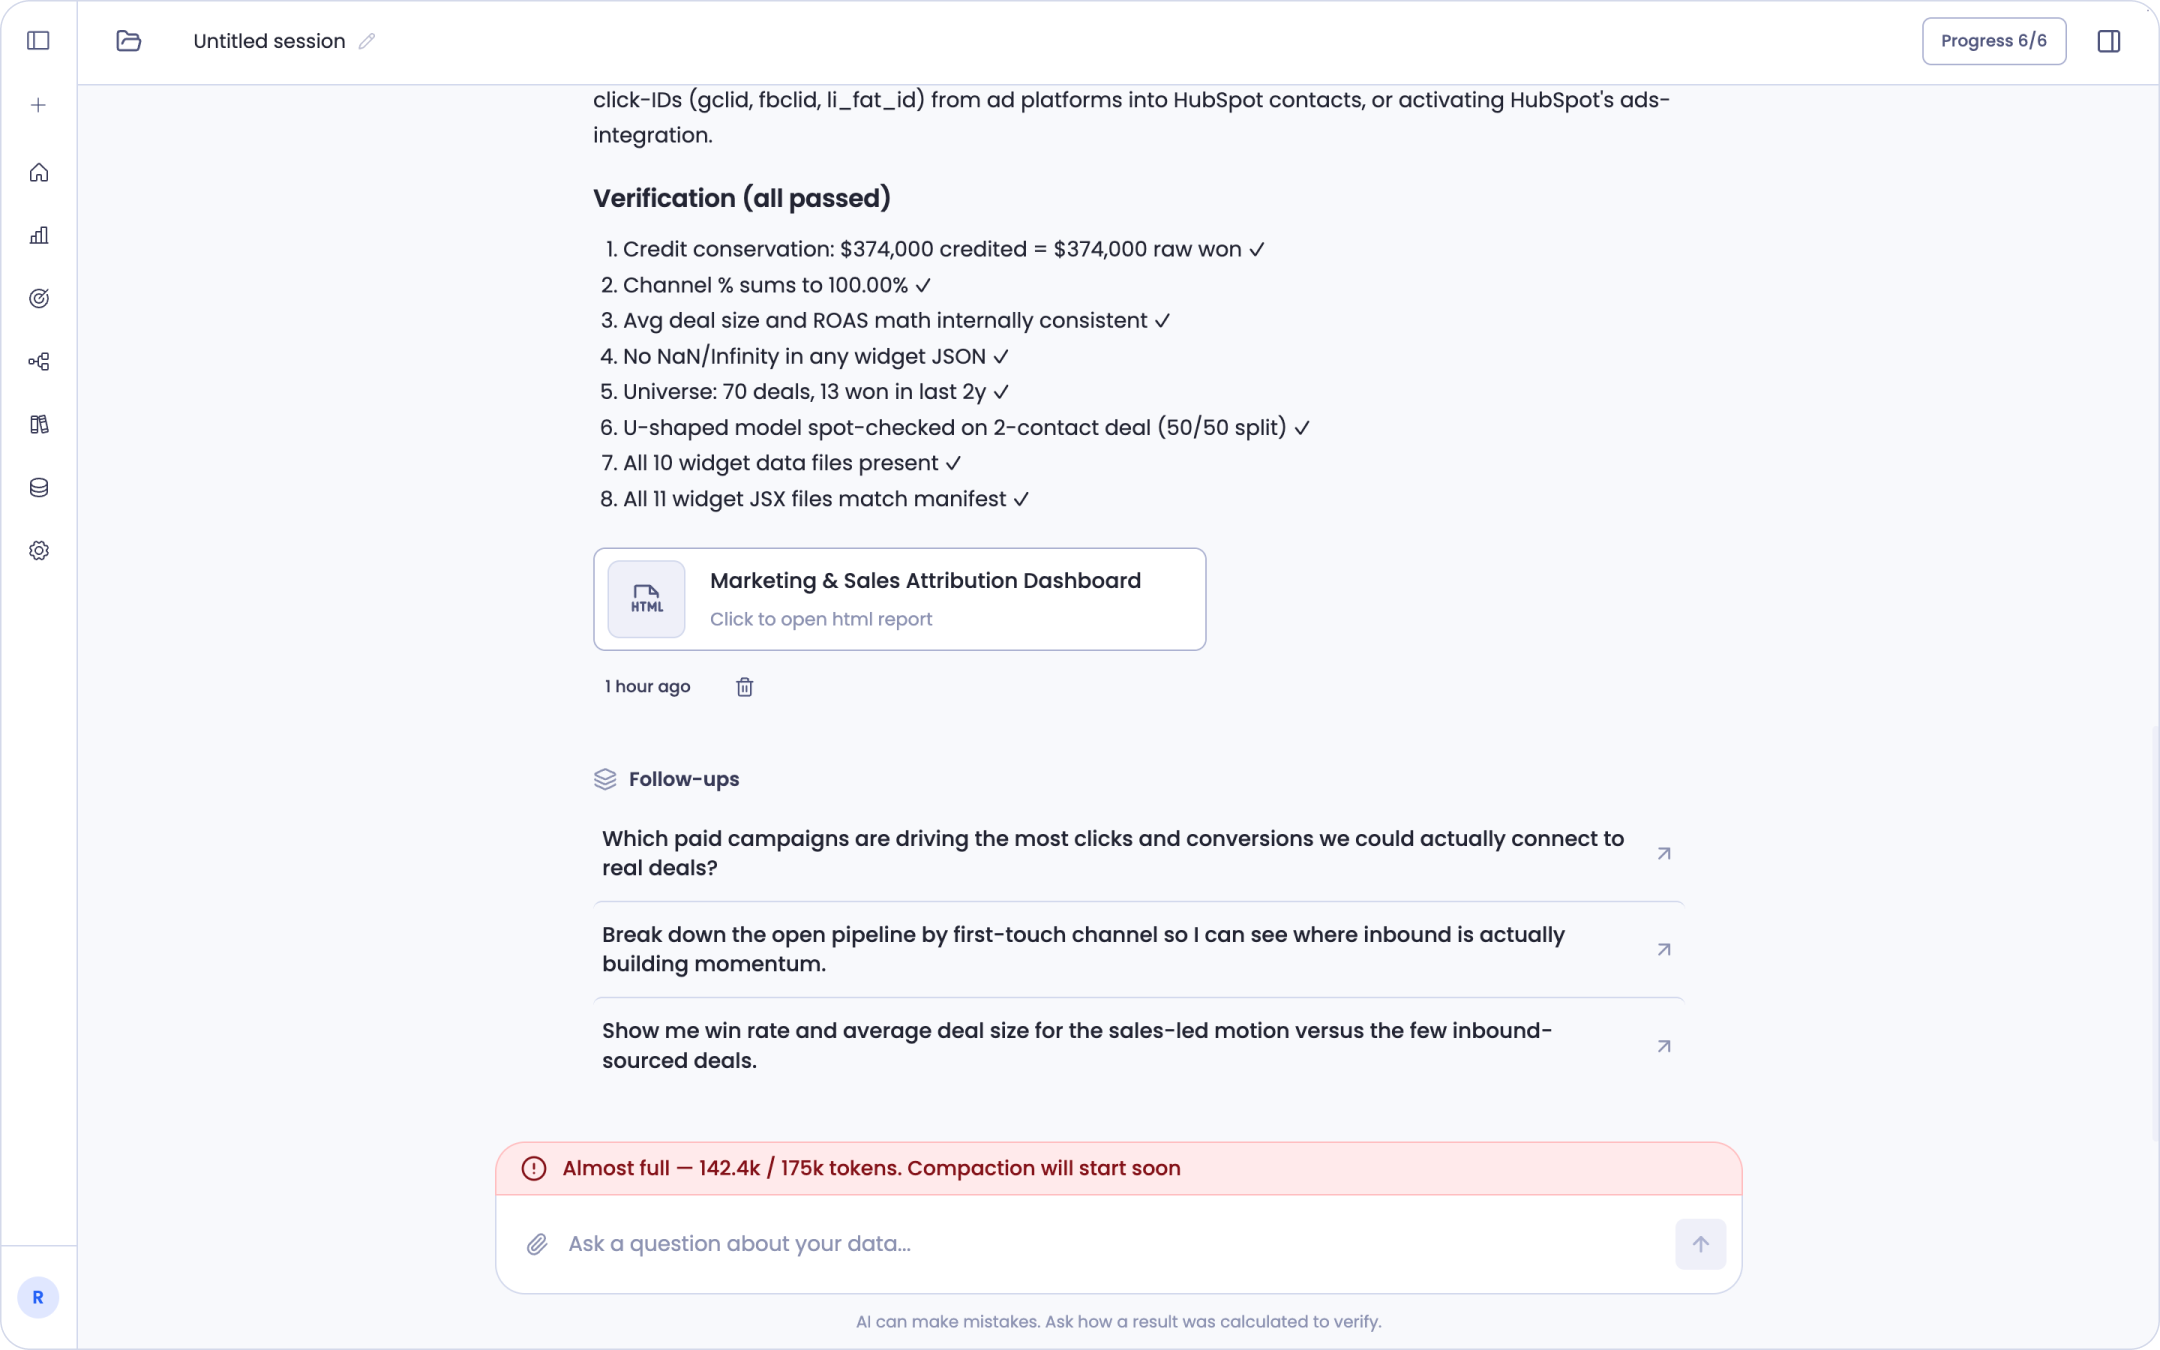
You don't have to do anything about it. Keep asking your next question, and if it pushes past the limit, Sage compacts the session automatically, freeing up room and carrying on. The conversation stays intact: Sage still remembers what came before, so you can reference the dashboard you built at the start or an audit you ran three questions ago, and it answers from that context without re-running anything. The warning is a heads-up, not a stop sign.
Check How a Result Was Reached
You don't have to take a number on faith. Whenever you want to double-check how a particular result was calculated or a step was carried out, ask Sage directly.
Ask "how did you work that out?" and it walks you back through what it did: which tables and columns it used, how it joined them, the date range it covered, and any data quirks it ran into along the way, like nulls, duplicates, or values that didn't line up. The same works before you build, too. Ask what's in a source and Sage profiles it for you, so you can answer "can I even measure this?" before you start.
This matters most when you're new to a dataset, or when a number looks off and you need to find out whether the problem is the analysis or the data feeding it.
Bring In Your Own Data
Your connected sources aren't the limit. You can bring in data two ways, and then work with it alongside everything else.
Connect a new source and it joins the same workspace as the rest of your data, so you can blend it with what's already there, join it against your CRM or your warehouse, and build analysis that spans all of it. You can also bring a file straight into a session, when what you have is a spreadsheet rather than a system to connect.
Either way, the point is the same: the custom questions that don't fit any single tool's reporting, the ones that need two or three sources brought together, become answerable in one place.
Connecting a source and uploading a file suits different situations. A short guide to when to use each is coming.
Define Your Own Metrics
Every team has its own language. What counts as a qualified lead, how you define win rate, when your fiscal year starts: these are decisions, not facts, and Sage lets you set them rather than guess.
Tell Sage your definition and it applies it. To make it permanent, save it as a Key Definition. A saved definition persists across sessions and is applied consistently to every analysis, so "win rate" means the same thing on Monday as it did last month, and the same thing for you as for your teammate.
Key Definitions sit within a broader idea called context. Context is anything you want Sage to keep in mind, like a rule for how tables should be joined or how you bucket channels. A Key Definition is the narrower case, a specific metric or formula. Both are saved as files and live together in your context library.
Seeing what Sage knows
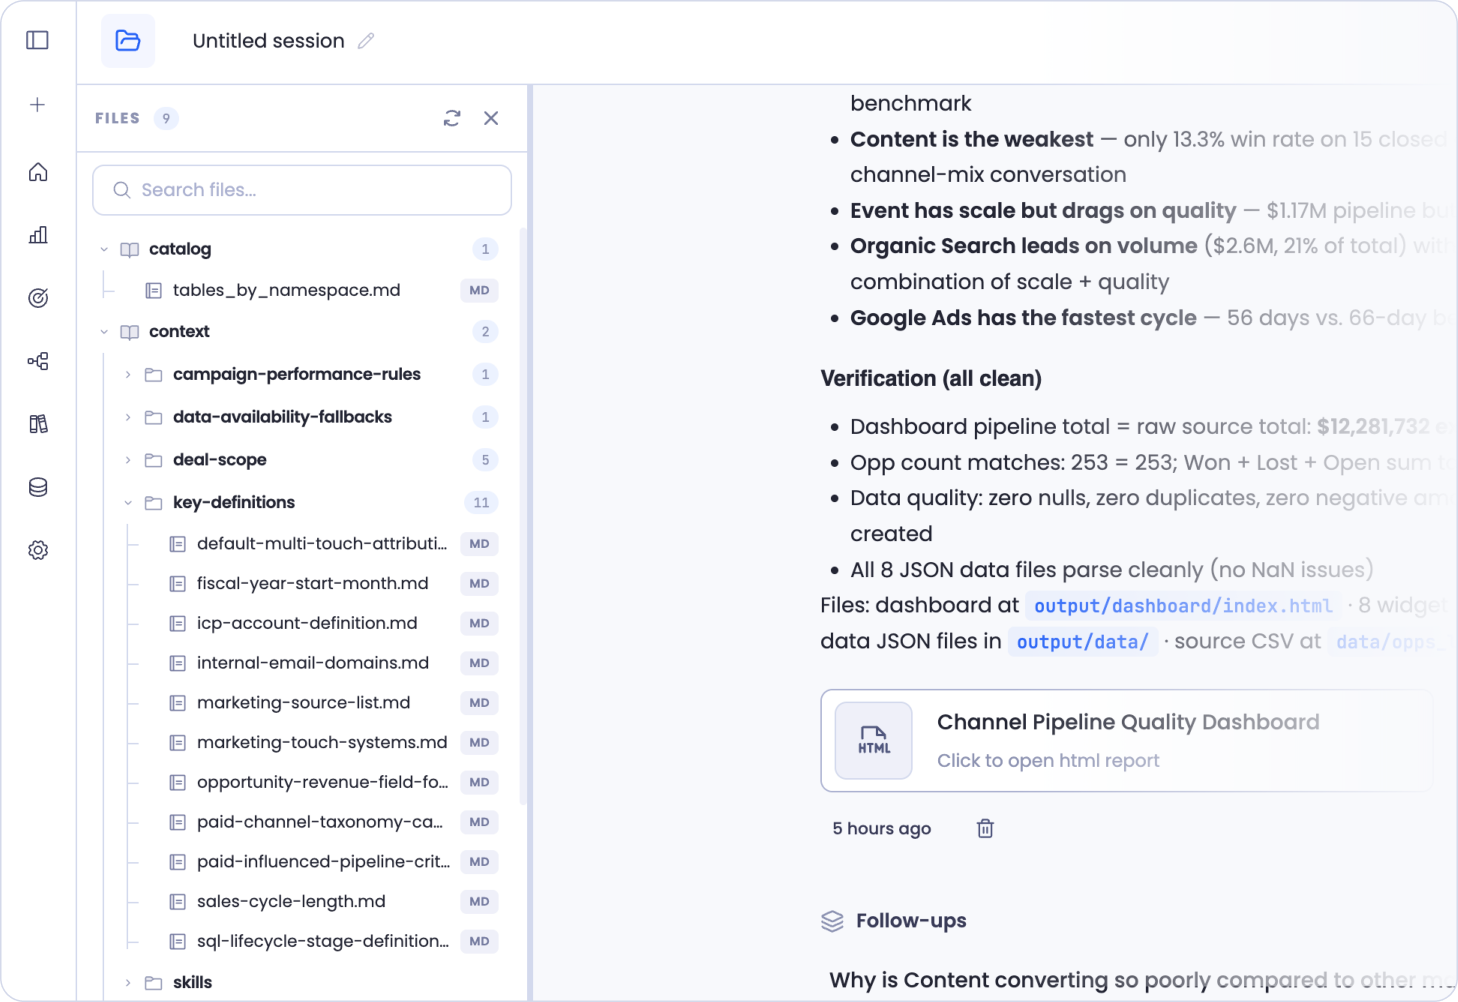
Open the Files panel from the left of the chat to see everything Sage is working with: your context folder (with Key Definitions and skills inside), the data catalog, your source data, and the outputs it has built. Each Key Definition is a small file you can open and read, so the meaning behind any metric is never hidden.
Applying one on purpose
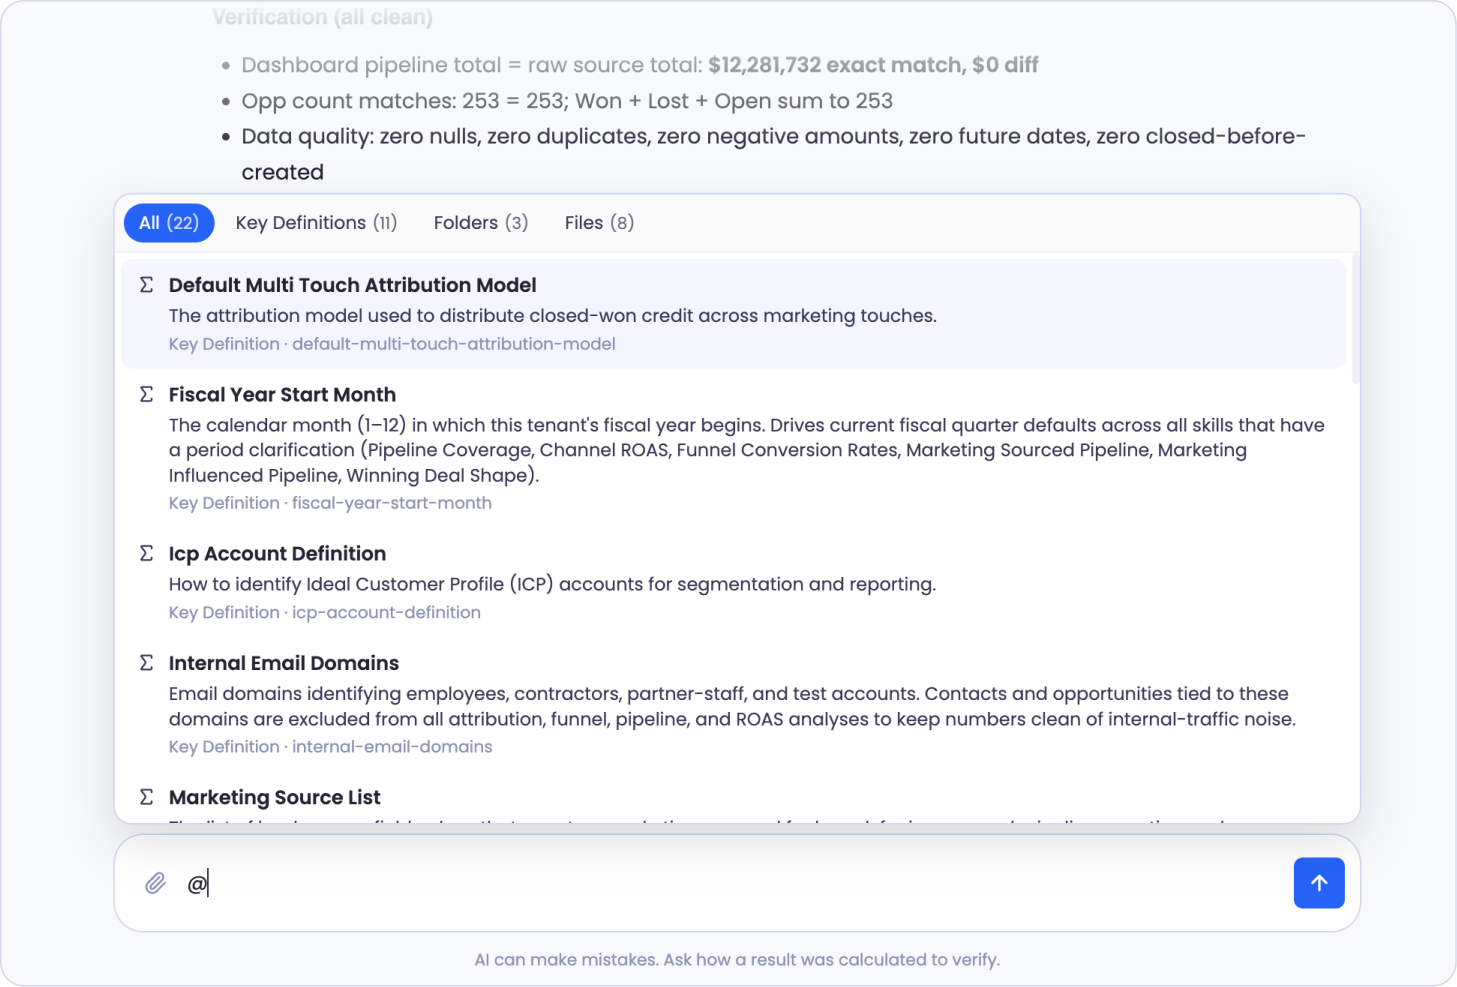
Sage uses your definitions automatically, but you can also point it at a specific one. Type @ in the chat bar and a picker opens, listing your Key Definitions, folders, and files, each with a short description. Choose one to pull it into your message, and Sage models the answer using exactly that definition.
This is how you get precise. Tag your fiscal-year definition and ask for "last quarter," and there's no ambiguity about which quarter you mean. Tag an attribution model and the numbers follow that model, not a default.
Who can change these
Managing context is limited to admins. If you're an admin, you can create and edit a definition straight from chat, just describe it and Sage saves it. Organizing your library, moving files between folders, grouping them into new folders, and deleting a definition, happens on the context management page.
This is the short version. Creating, editing, and managing context and Key Definitions is done by admins, and it has its own guide. See Managing Context and Key Definitions.
Build Something With It
An answer in chat is often just the start. Sage can turn your analysis into something you keep and share:
- Dashboards, the live, multi-widget view of your metrics
- Reports, a static, shareable write-up of what you found, saved as an artifact you can open and send on
- Excel exports, your analysis as sheets and graphs, ready for Google Sheets or a workbook
- CSV exports, a data list you can push to Salesforce, Sheets, or wherever it needs to go
You describe what you want and Sage builds it, then you can iterate: add a widget, change a date range, or break a number down further, all in conversation.
Today, publishing and scheduled refresh apply to dashboards. A published dashboard is verified, kept current on a schedule, and can carry outputs like summaries and Slack delivery. Reports, Excel, and CSV exports are things you build and take with you now; publish-and-refresh support for them is on the way.
From Analysis to Something Trusted
Building something is one step. Deciding it's trustworthy enough to share is another, and Sage keeps those separate on purpose.
When you're ready to publish a dashboard, you go through Verify first: a checkpoint where the result is confirmed before it goes live. This is separate from the checks Sage runs as it builds. Those tell you a number holds up; this is the formal gate that turns a trustworthy result into a published, shareable one. Publishing then turns your analysis into a workflow, a repeatable sequence that reruns cleanly on new data. See Understanding Workflows for how that foundation works, and Building a Dashboard for the full publish flow.
Sage Everywhere
Sage isn't only in the main workspace. The same engine shows up wherever you need it:
- On a published dashboard, preloaded with that dashboard's history, so you can ask follow-up questions about the numbers in front of you. See Using Sage on a Dashboard and History Folder.
- In Slack, you can ask questions and build dashboards without leaving the channel. See Sage in Slack.
It's the same Sage in each place, with the same access to your data and the same way of working. Where you open it just changes what it starts with.
One thing that follows from this: a brand-new session starts blank, with no memory of a dashboard you built elsewhere. To carry a dashboard's logic into a fresh session, hand it that dashboard's lineage. See Reusing a Published Dashboard.
Keep in Mind
It reads, it doesn't write. Sage queries your data; it doesn't change, delete, or write back to your sources.
Answers are traceable. Every number comes from a query you can inspect. Ask how a figure was calculated and Sage shows its work.
Publish what needs to be trusted. An answer in chat is grounded in real data, but it hasn't been through verify-and-publish. For a number others will rely on, publish it. See Understanding Workflows.
Getting Help
If you have questions, run into issues, or want to share feedback on the experience, reach out to us directly at support@petavue.com. We're available and responsive, and your input matters.