Building a Dashboard
Create dashboards from scratch through conversation. You describe what you need, the AI builds it, and you take it through the Verify and Publish flow, built for confidence in every number, today and on every refresh.
What You Can Do
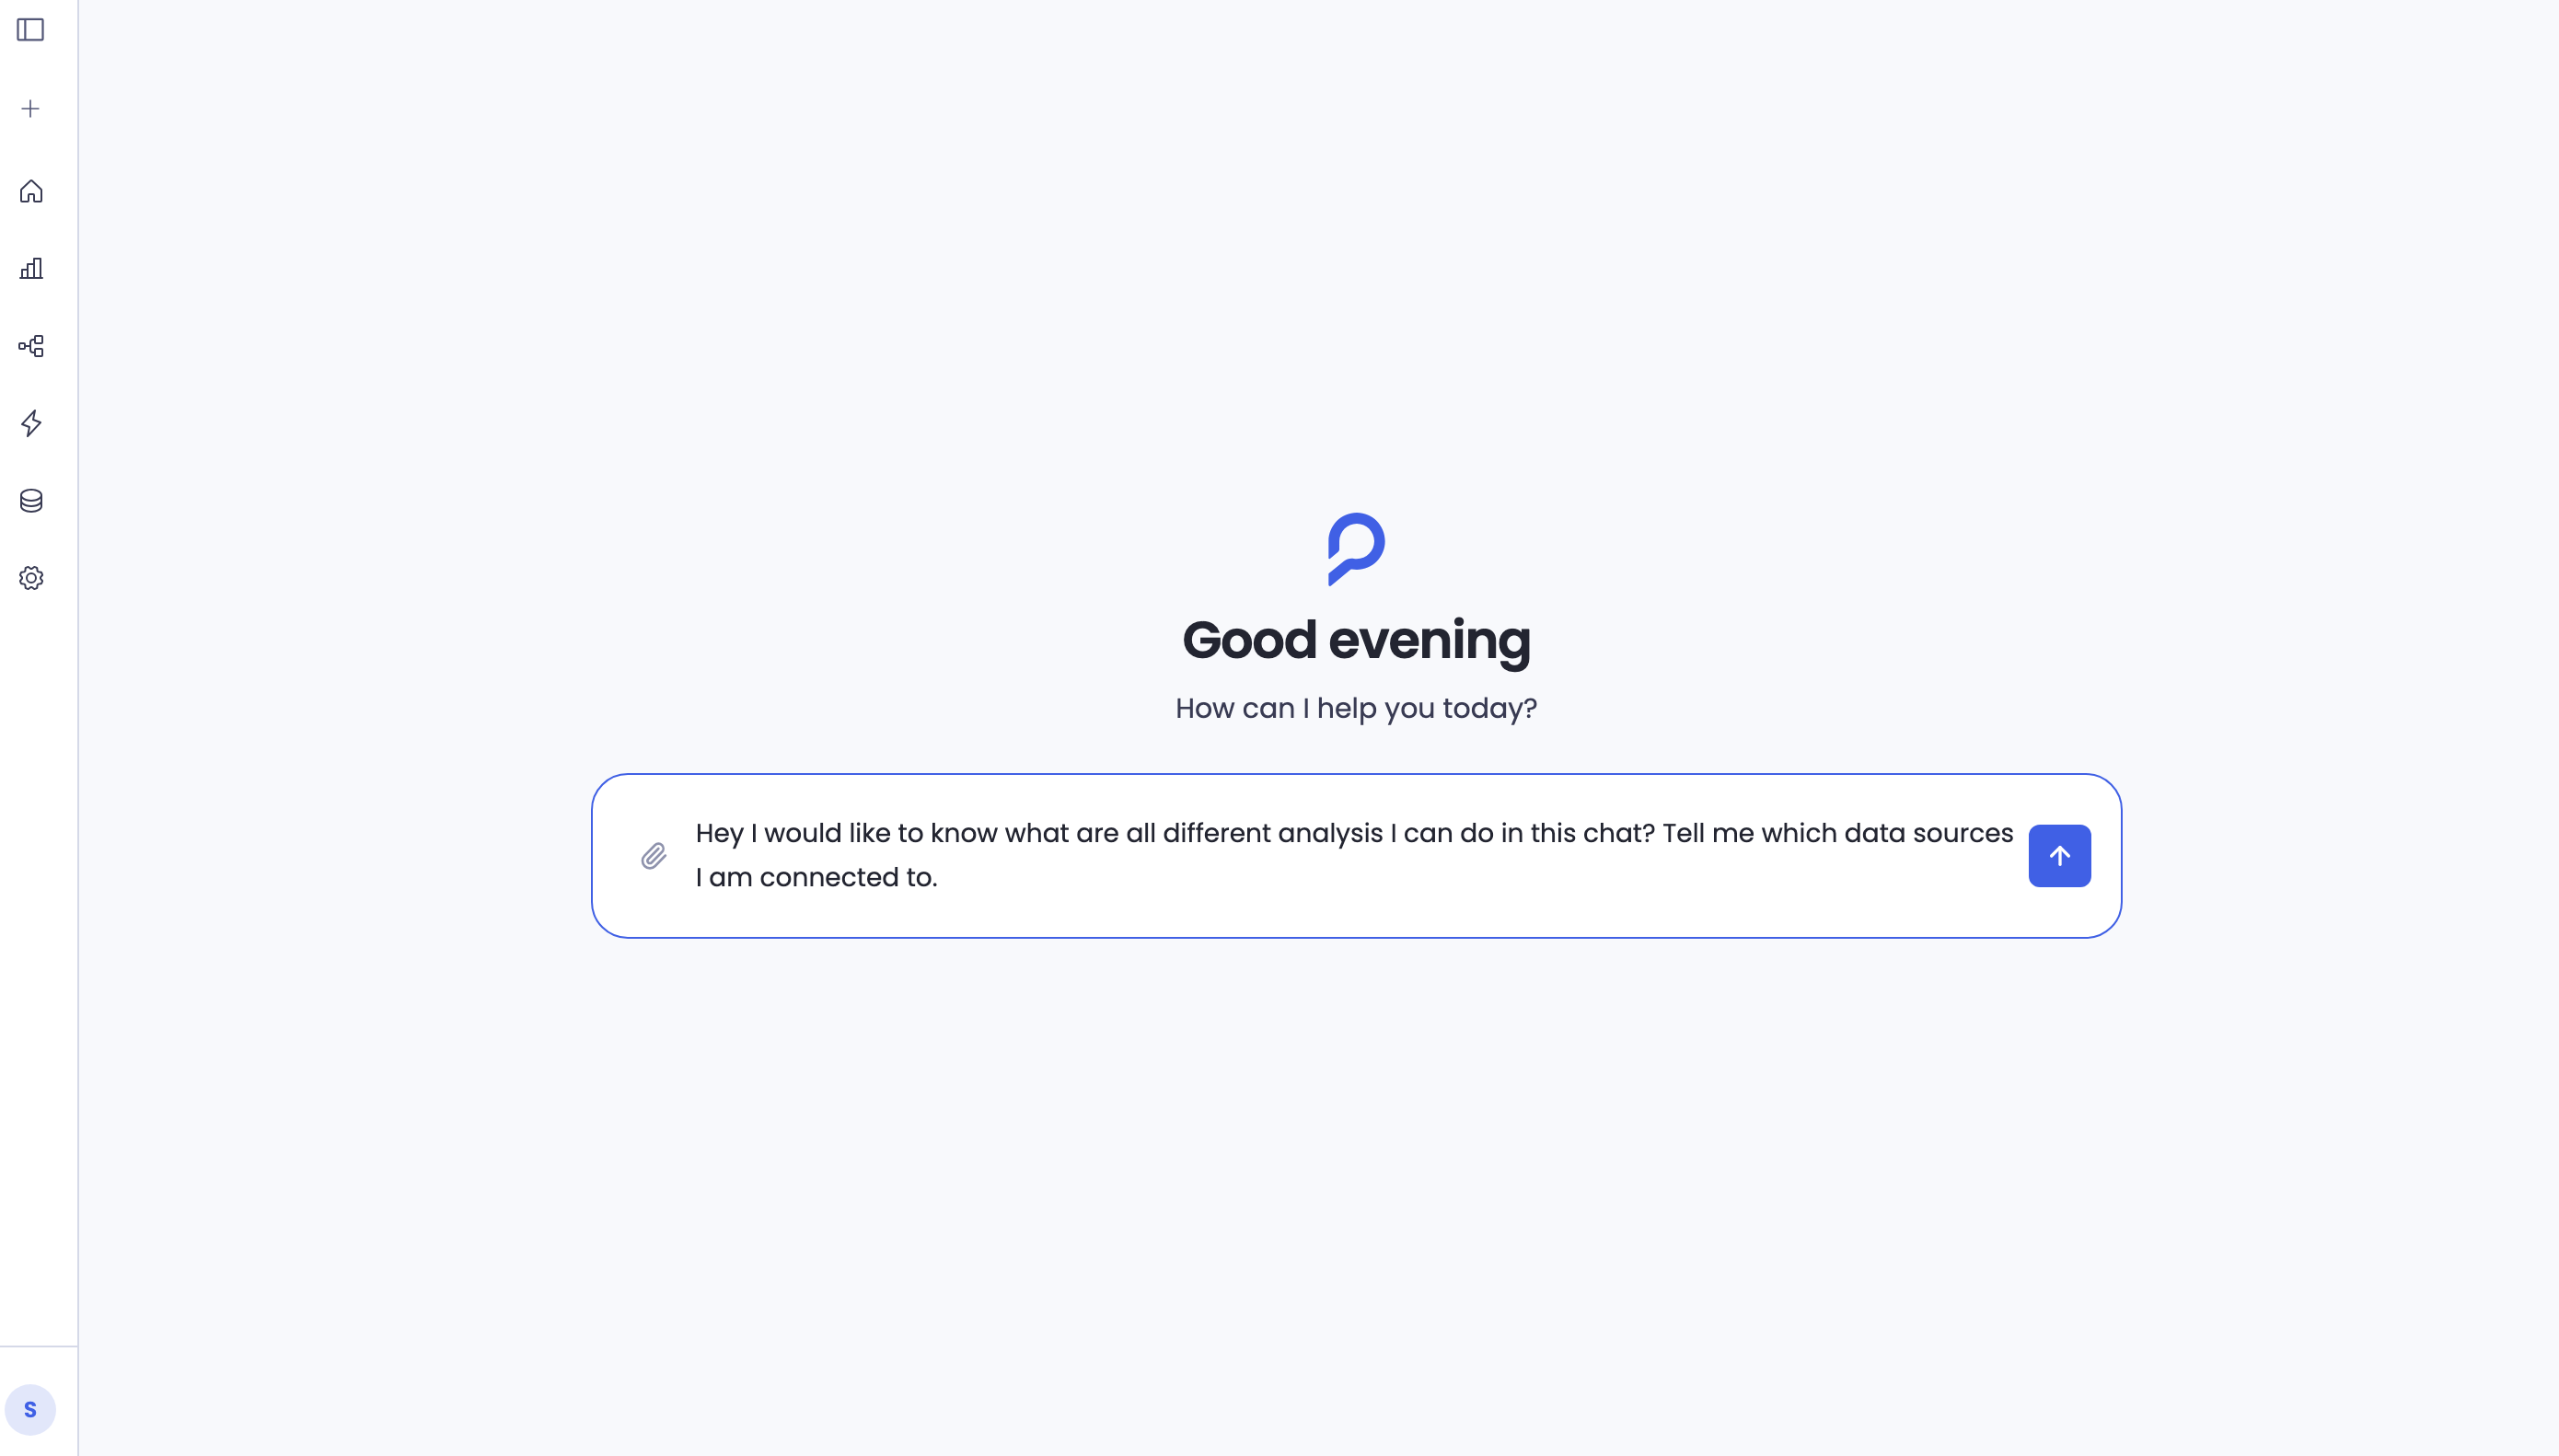
The AI workspace is a chat-based environment where you work with an AI agent to analyze your data, explore questions, and build outputs. It's a general-purpose analytics environment, and you can use it for:
- Creating dashboards: the focus of this guide, with the full Verify and Publish flow described below
- Ad hoc analysis: ask any data question and get an answer with supporting analysis
- Individual charts: generate specific visualizations to download for presentations or slide decks
- Executive summary reports: create narrative reports with data analysis and export them to PDF
The dashboard is the first output type that's fully publishable and refreshable through the platform. Other output types work in the session but don't yet have the same publish and refresh pipeline.
Building Your Dashboard
Start a conversation
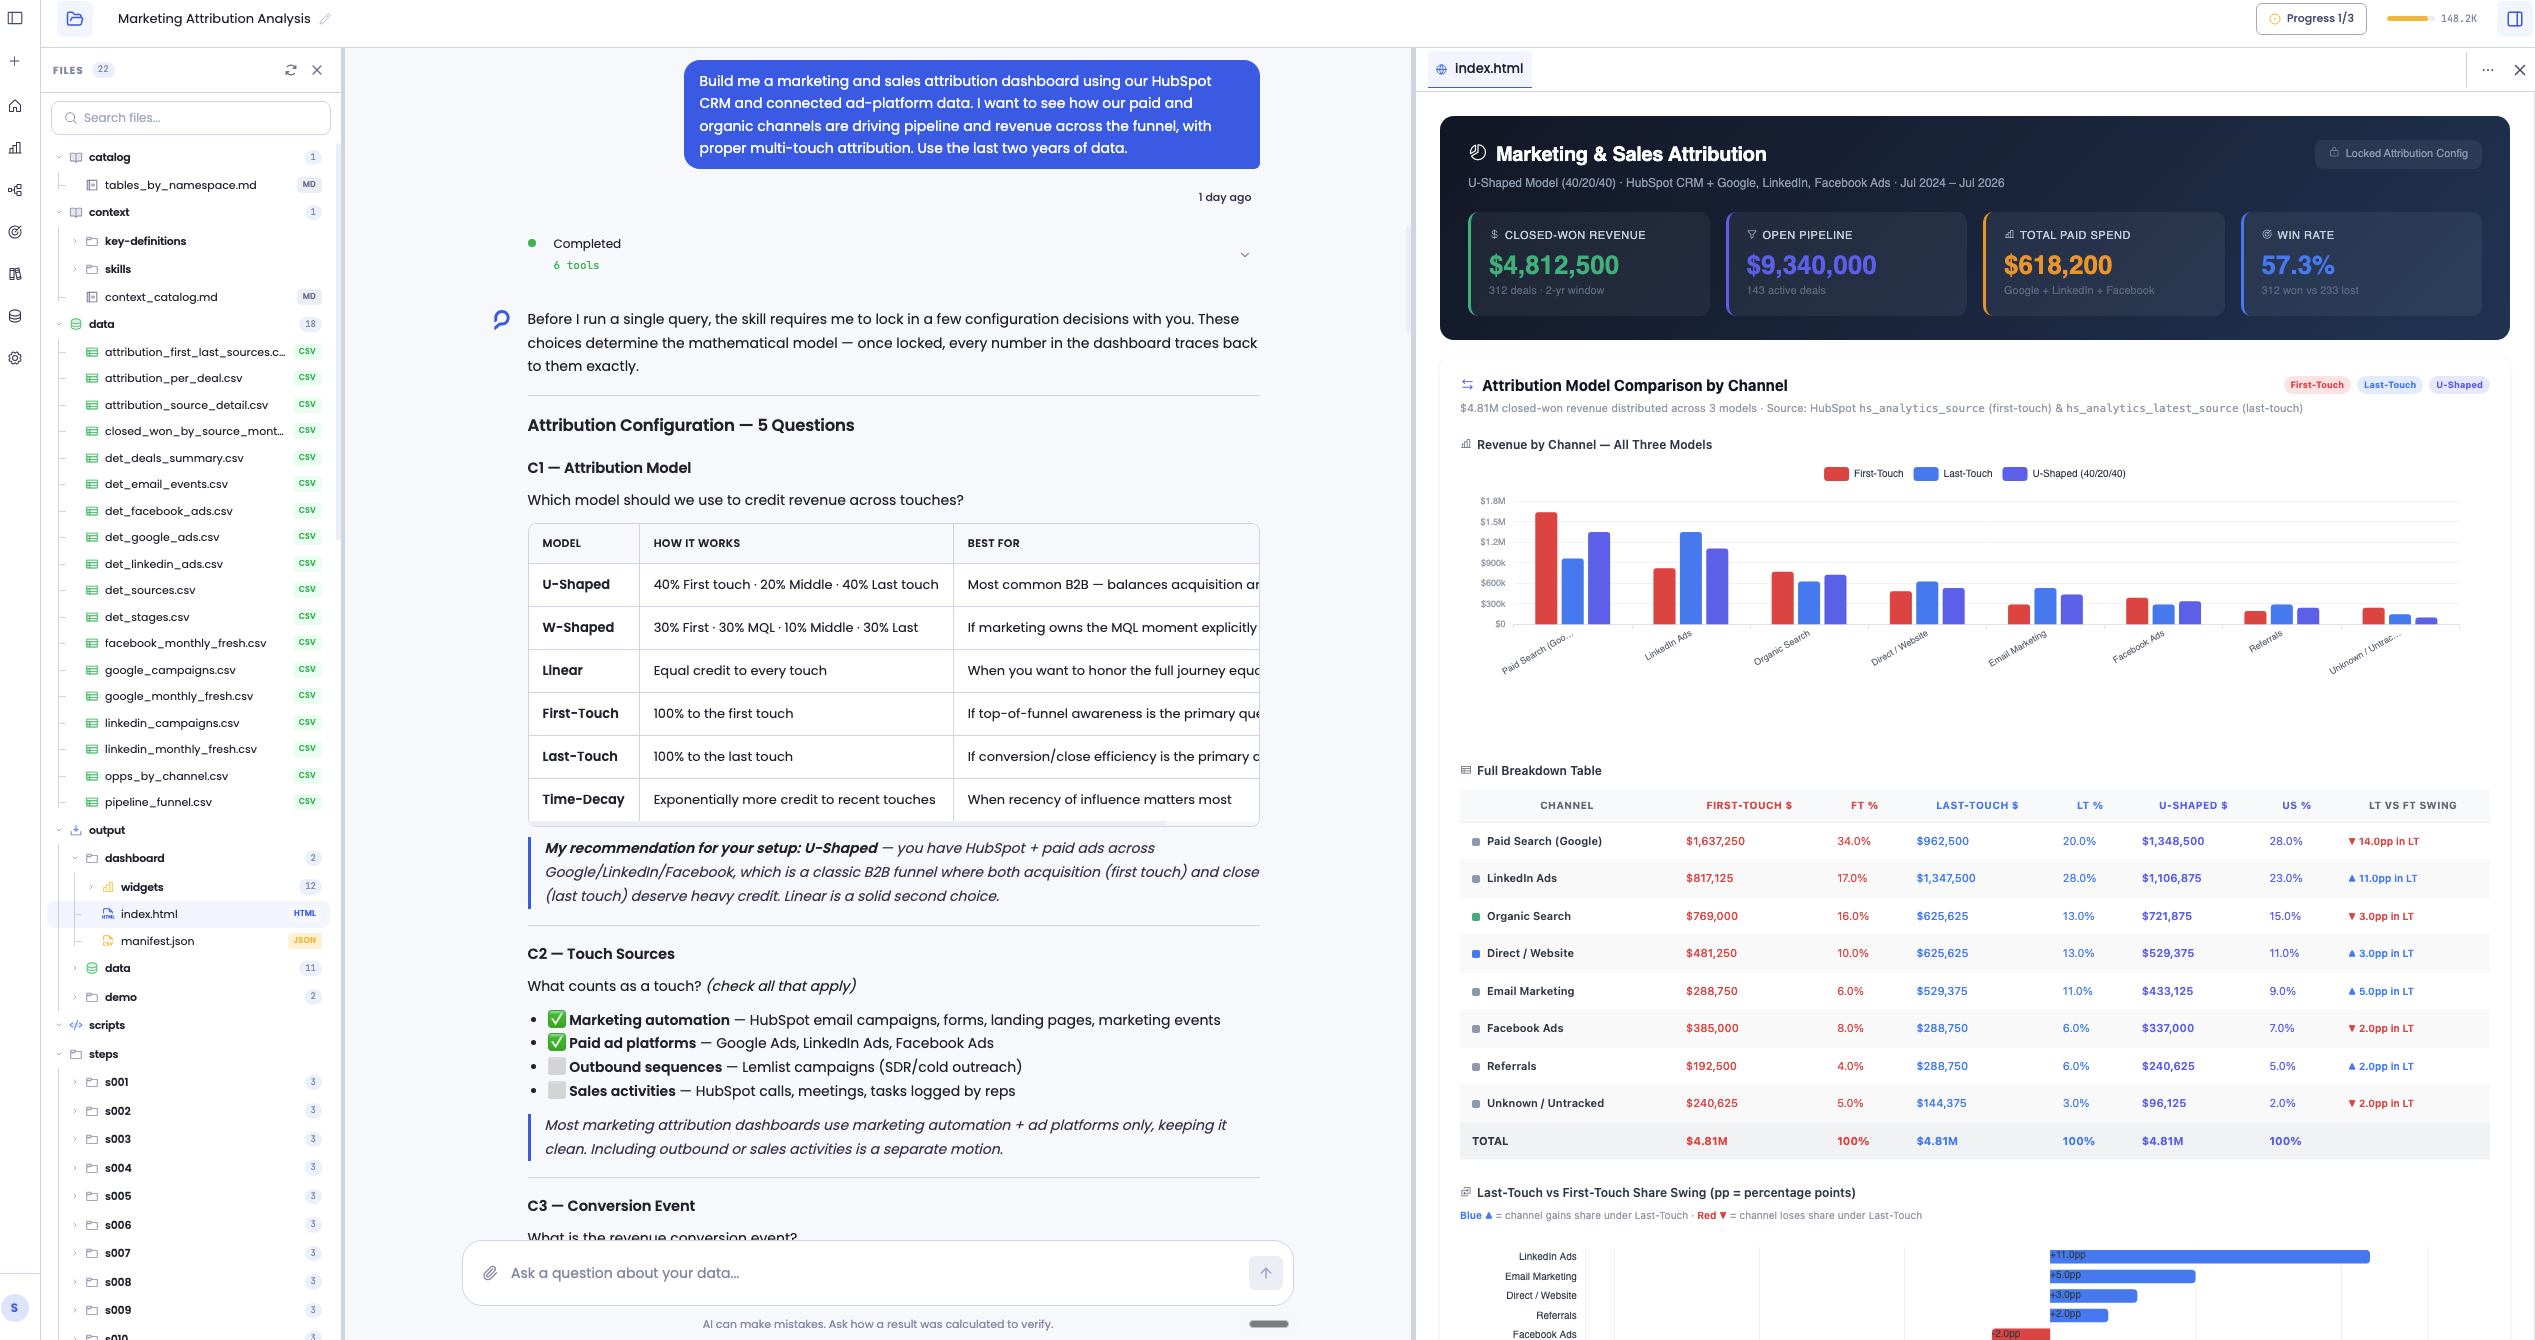
Open a new session and describe the dashboard you want. Be specific about the data you're working with and what you'd like to see.
"Build me a marketing attribution dashboard using our HubSpot CRM and ad-platform data: show sourced and influenced pipeline by channel, comparing first-touch, last-touch, and multi-touch models"
"Create a campaign attribution dashboard that ties spend and closed-won revenue back to each campaign and channel, with ROAS and cost per opportunity"
"I need a funnel dashboard tracking conversion from MQL to SQL to opportunity to closed-won, with drop-off and average time at each stage"
The AI starts building your dashboard, creating data queries, running calculations, and generating widgets like KPI cards, charts, tables, and funnels. You'll see it take shape in the preview panel as the conversation progresses, and you can ask for changes along the way, such as adding widgets, adjusting calculations, changing colors, or modifying filters.
Verify your dashboard
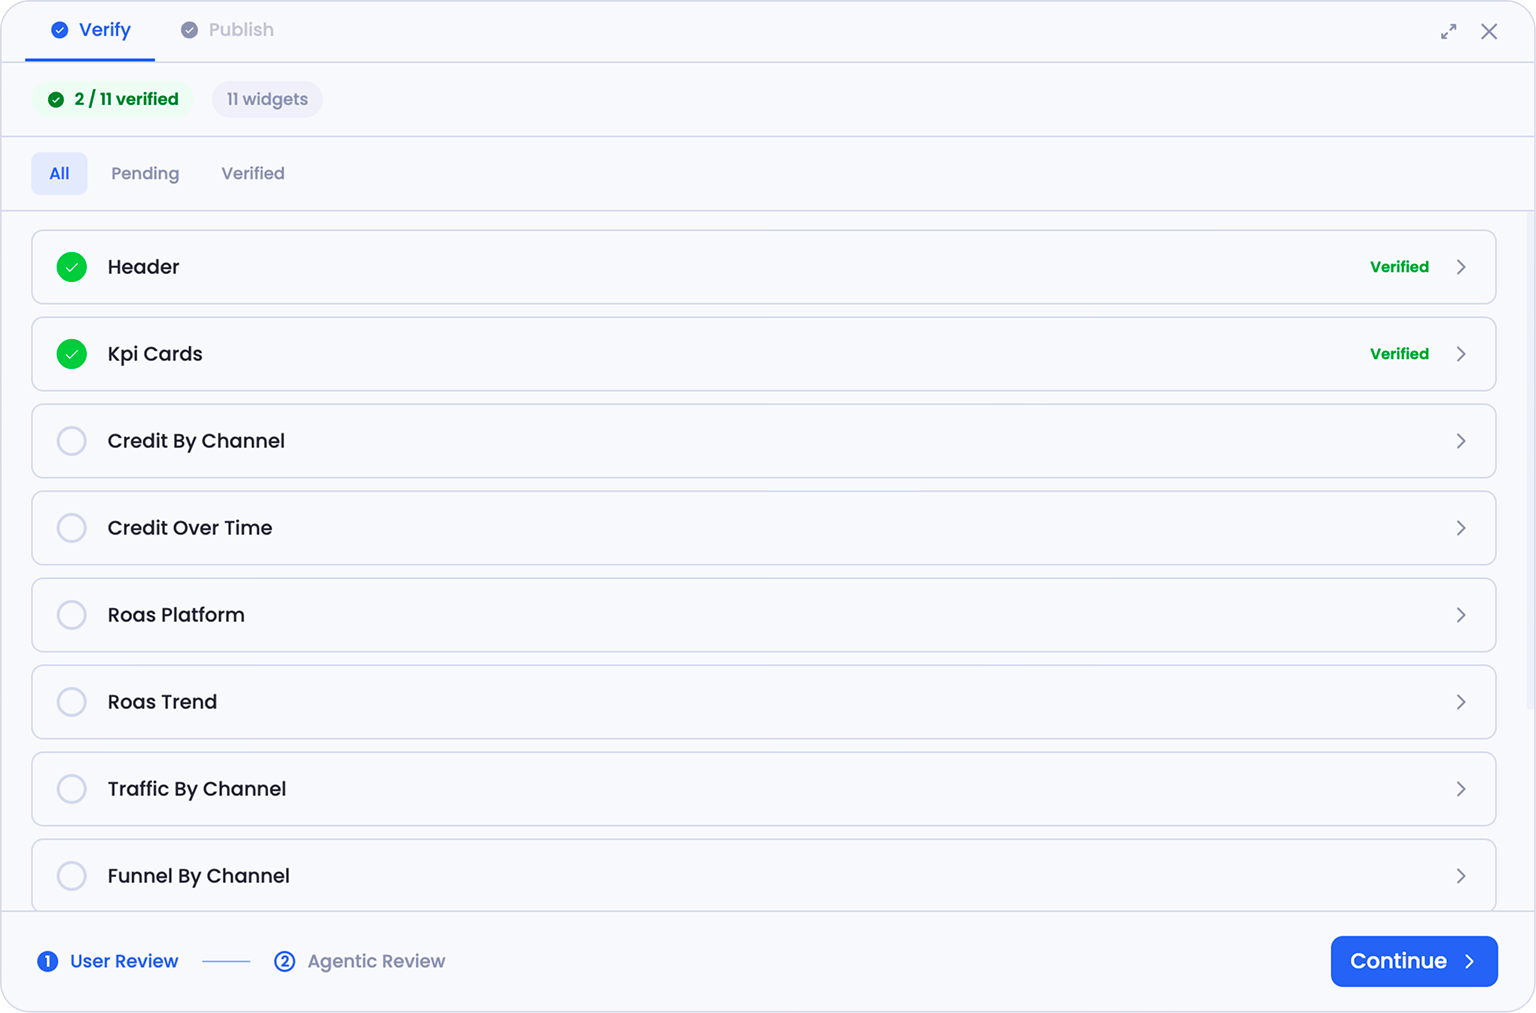
When the dashboard looks right in the session, click Verify & Publish. From here, everything lives under two tabs: Verify and Publish. Verify is where all the review happens, both yours and the AI's, and it runs in two steps.
Step 1: User Review
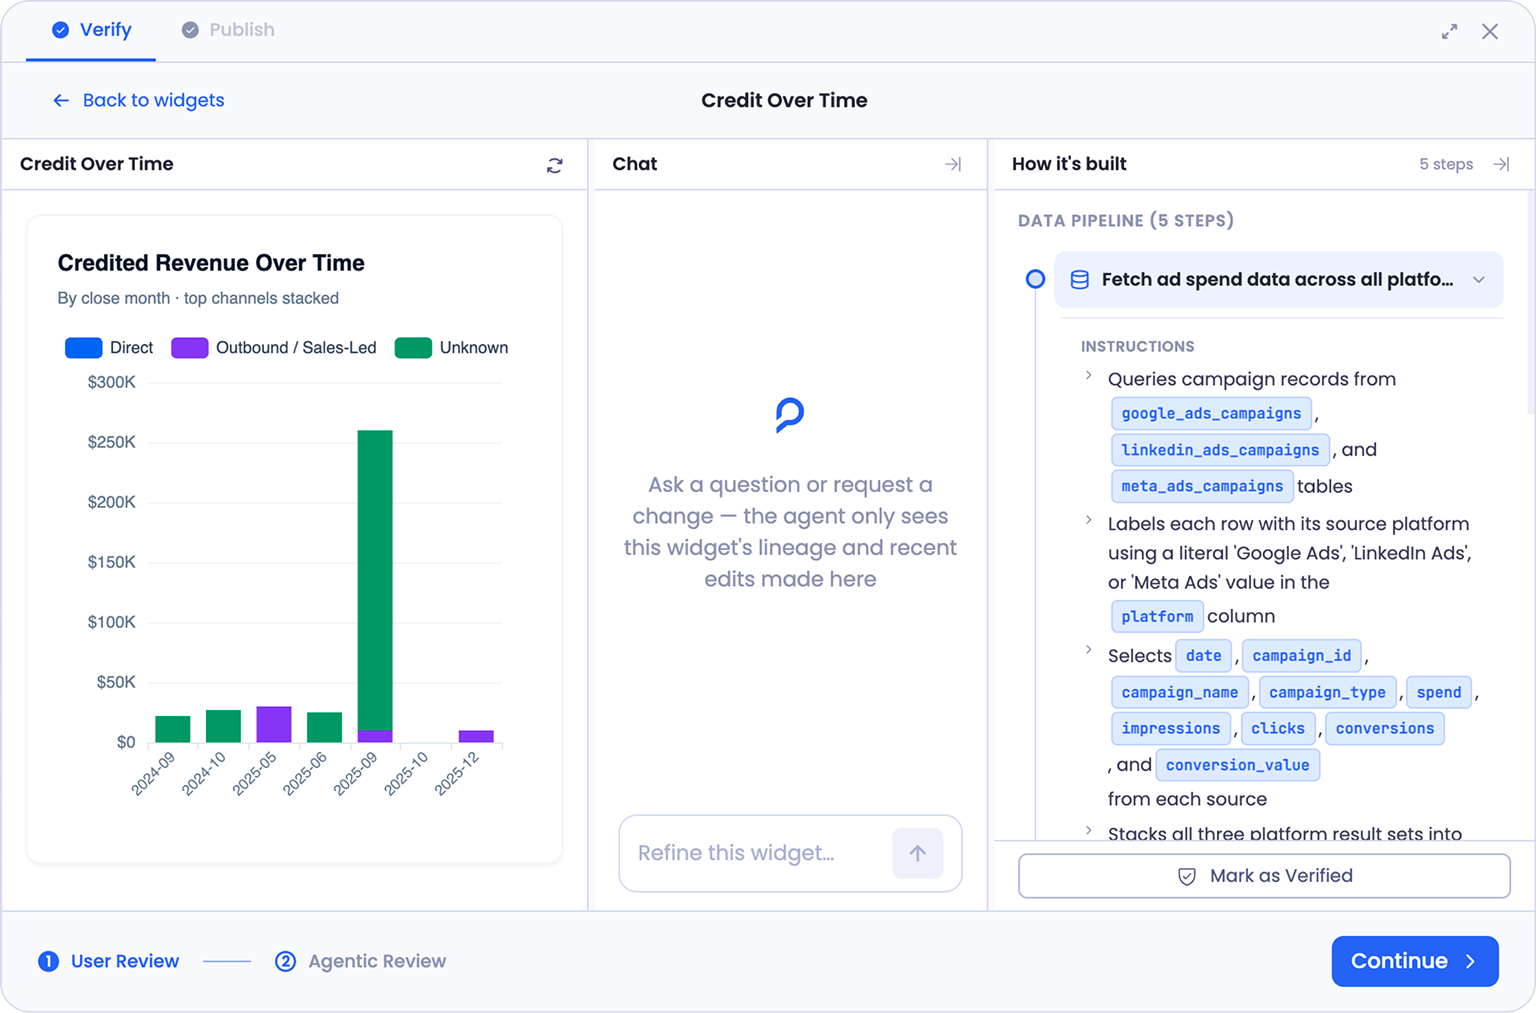
Every widget in your dashboard is listed with its verification status. Open any widget to drill in, where three things sit side by side:
- A live preview of the widget
- A scoped chat for changing that one widget: ask for a different chart type, a calculation tweak, new colors, or a filter change, and only that widget updates
- A "How it's built" panel that lists the steps behind the widget in order, from the first query through each calculation and transformation to the step that renders it. Open any step to see what it does in plain English, its Instructions, Conditions, and Outputs, the exact code, and which other widgets it affects
Check each widget and mark the ones you're happy with as verified.
To change one widget, make the request in that widget's scoped chat, rather than as a broad "redo the dashboard" instruction. A scoped request only touches the widget you mean, so the rest stays exactly as it was.
Verification itself is not compulsory. You don't have to review every widget and mark it verified before moving on. Some widgets you'll trust already. The checkboxes are a tracking tool, a simple way to keep tabs on what you've reviewed and what you haven't. How much you verify is entirely up to you.
Step 2: Agentic Review
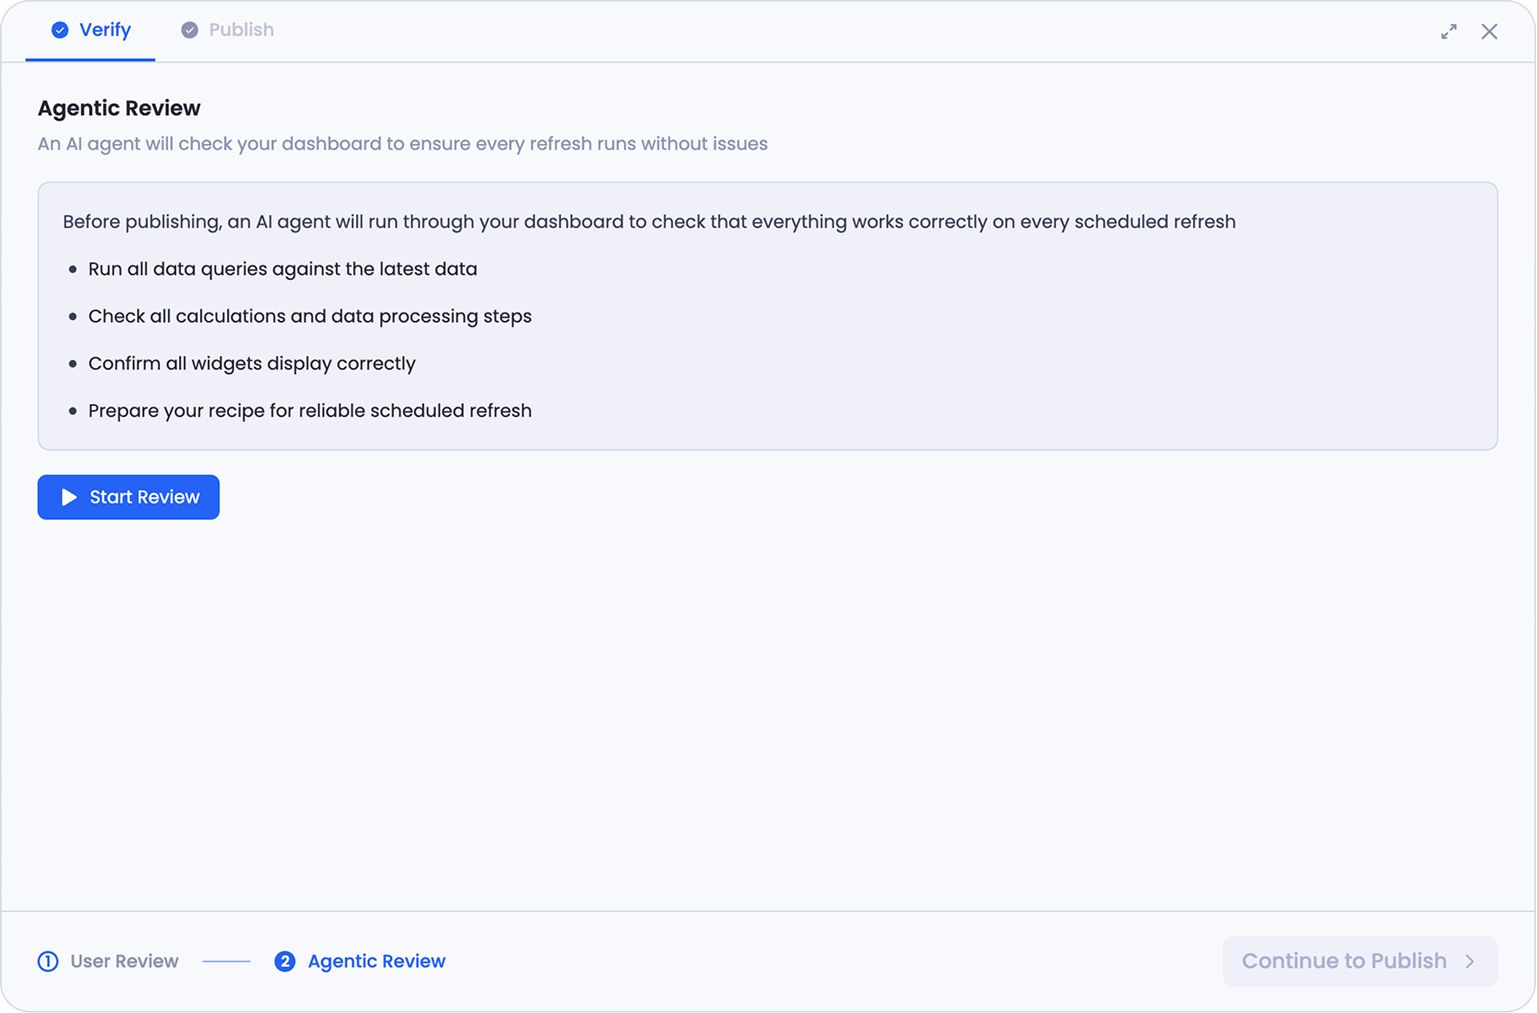
Once you've looked over your widgets, move to Agentic Review. Here an AI agent runs through the whole dashboard to make sure it holds up on every future refresh, not just today. It:
- Runs all data queries against the latest data
- Checks every calculation and data-processing step
- Confirms all widgets display correctly
- Prepares your workflow for reliable scheduled refresh
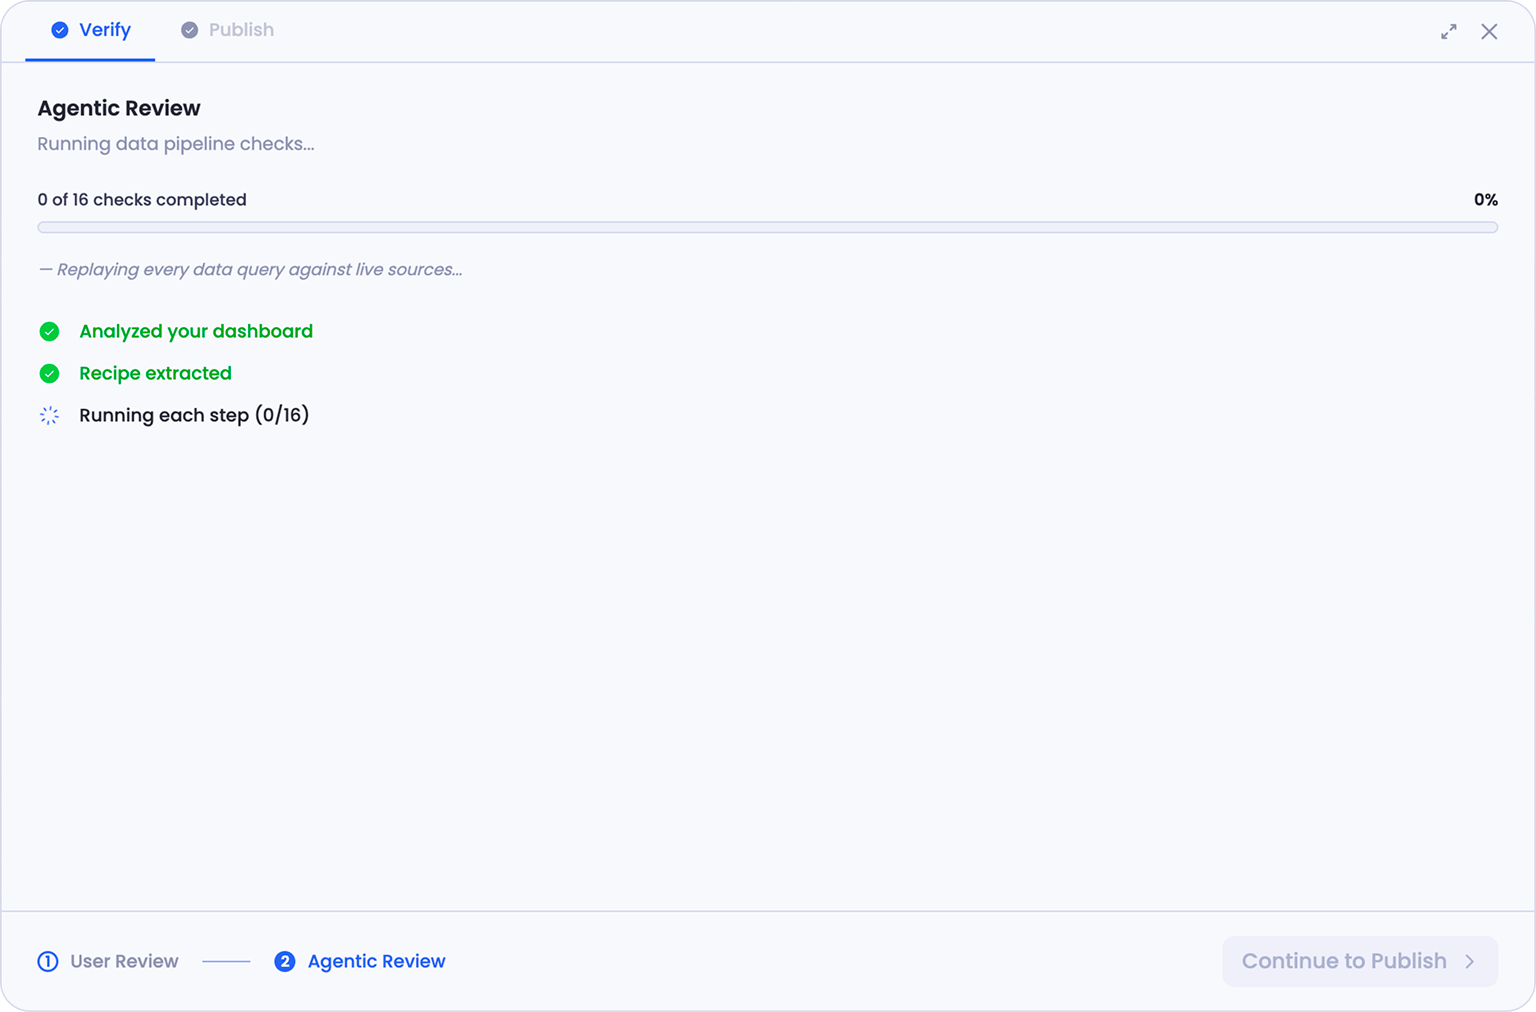
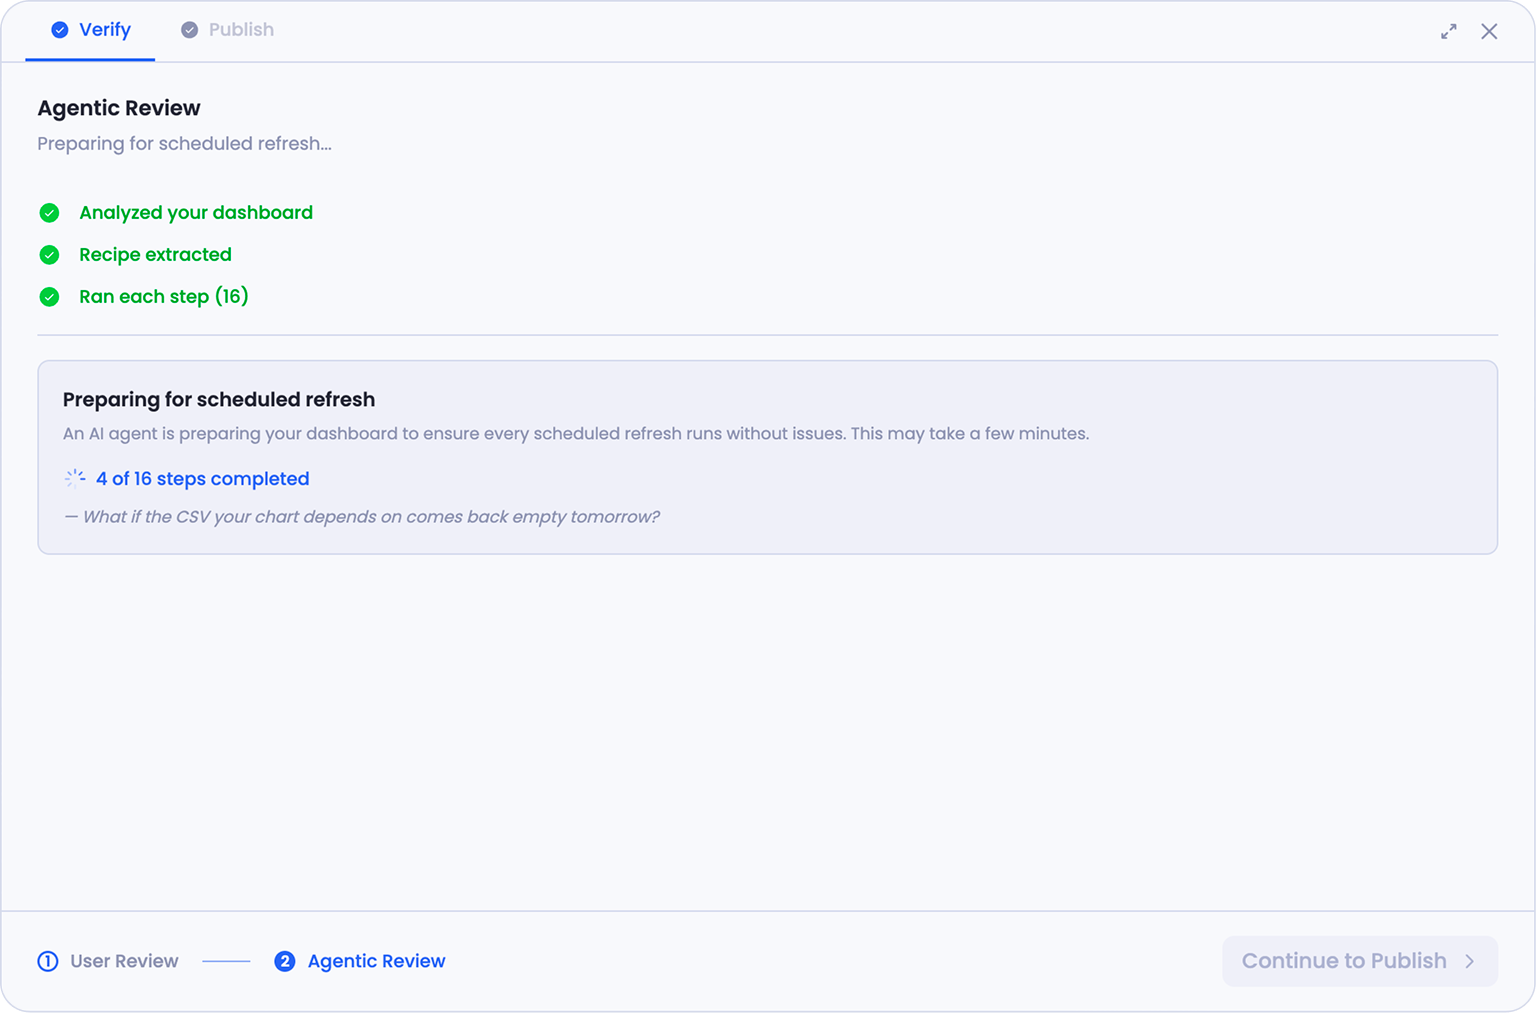
Behind the scenes, it analyzes your dashboard, extracts the workflow (the full sequence of analytical steps that produce your numbers), and runs each step to catch anything that would break on a future run, like a date hardcoded to a specific day, or a calculation that fails when data comes back empty. Unless you've hardcoded something on purpose, it adjusts the step to stay dynamic.
This takes a few minutes, depending on how many steps your dashboard has. You can wait and watch, or leave and come back. It keeps running in the background.
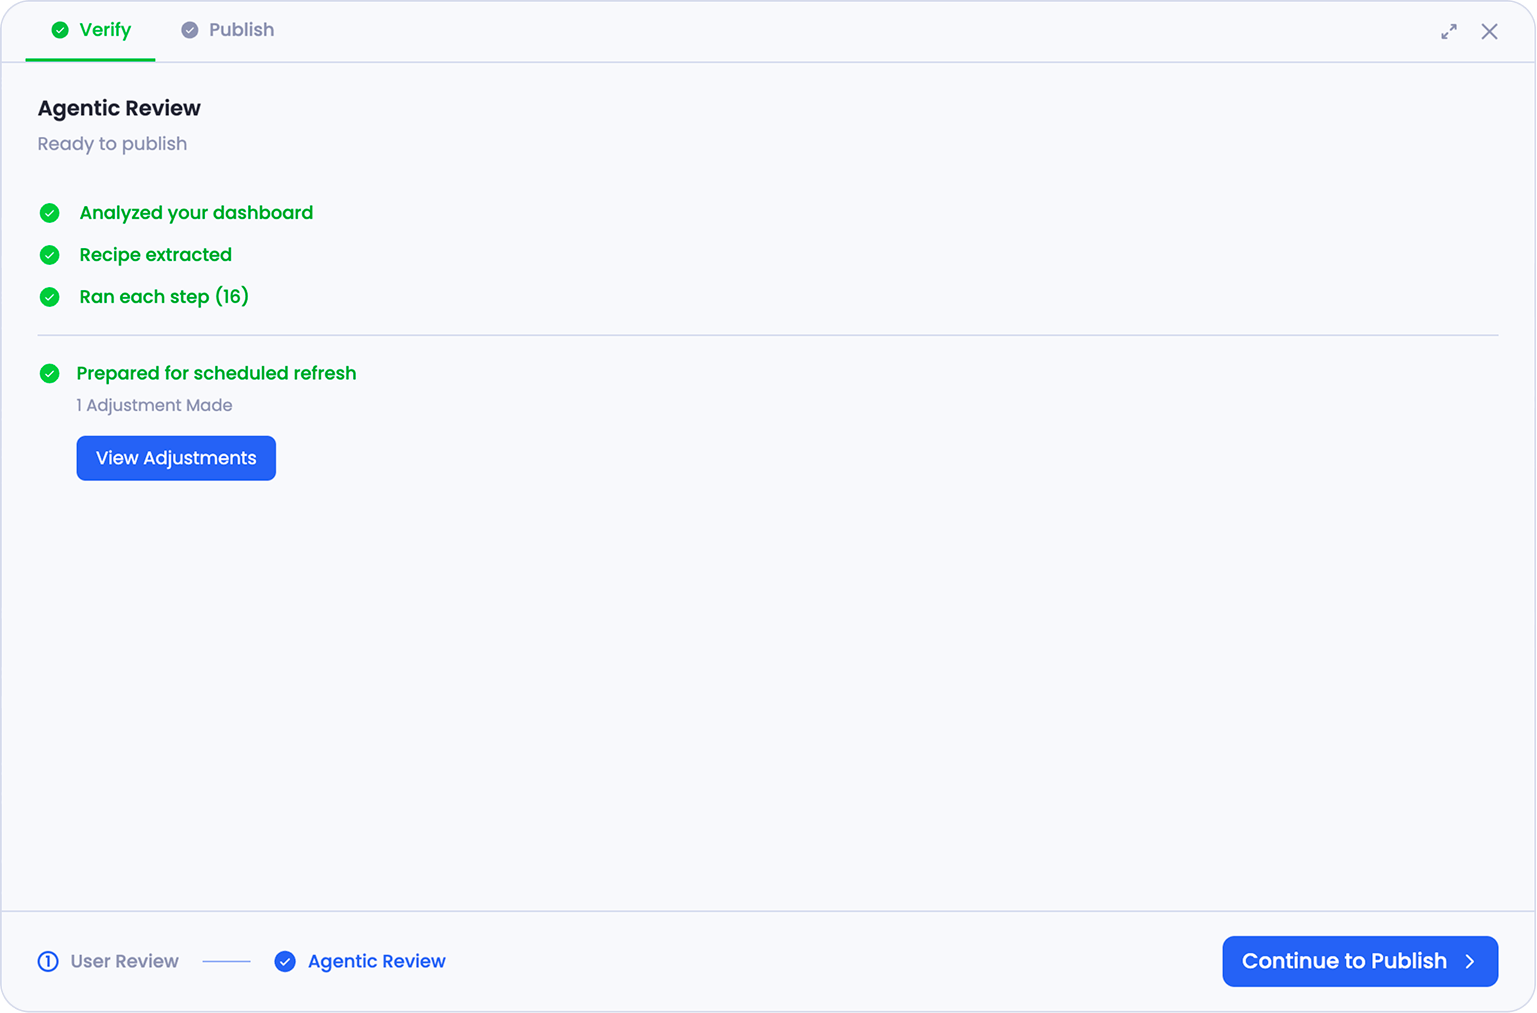
When it finishes, you'll see a summary of what changed. Click View Adjustments to see each adjusted step, why it changed, and the exact code diff.
The adjustments are yours to correct. If one isn't right, use the chat there to give feedback and the AI reworks that step. Every fix made here, both the AI's and your corrections, is pushed back to the source session, so when you return to that session for further edits, it already reflects the latest published version.
When you're satisfied, click Continue to Publish.
Publish
Publishing turns your reviewed dashboard into something live and, if you want, recurring. It runs in three quick steps.
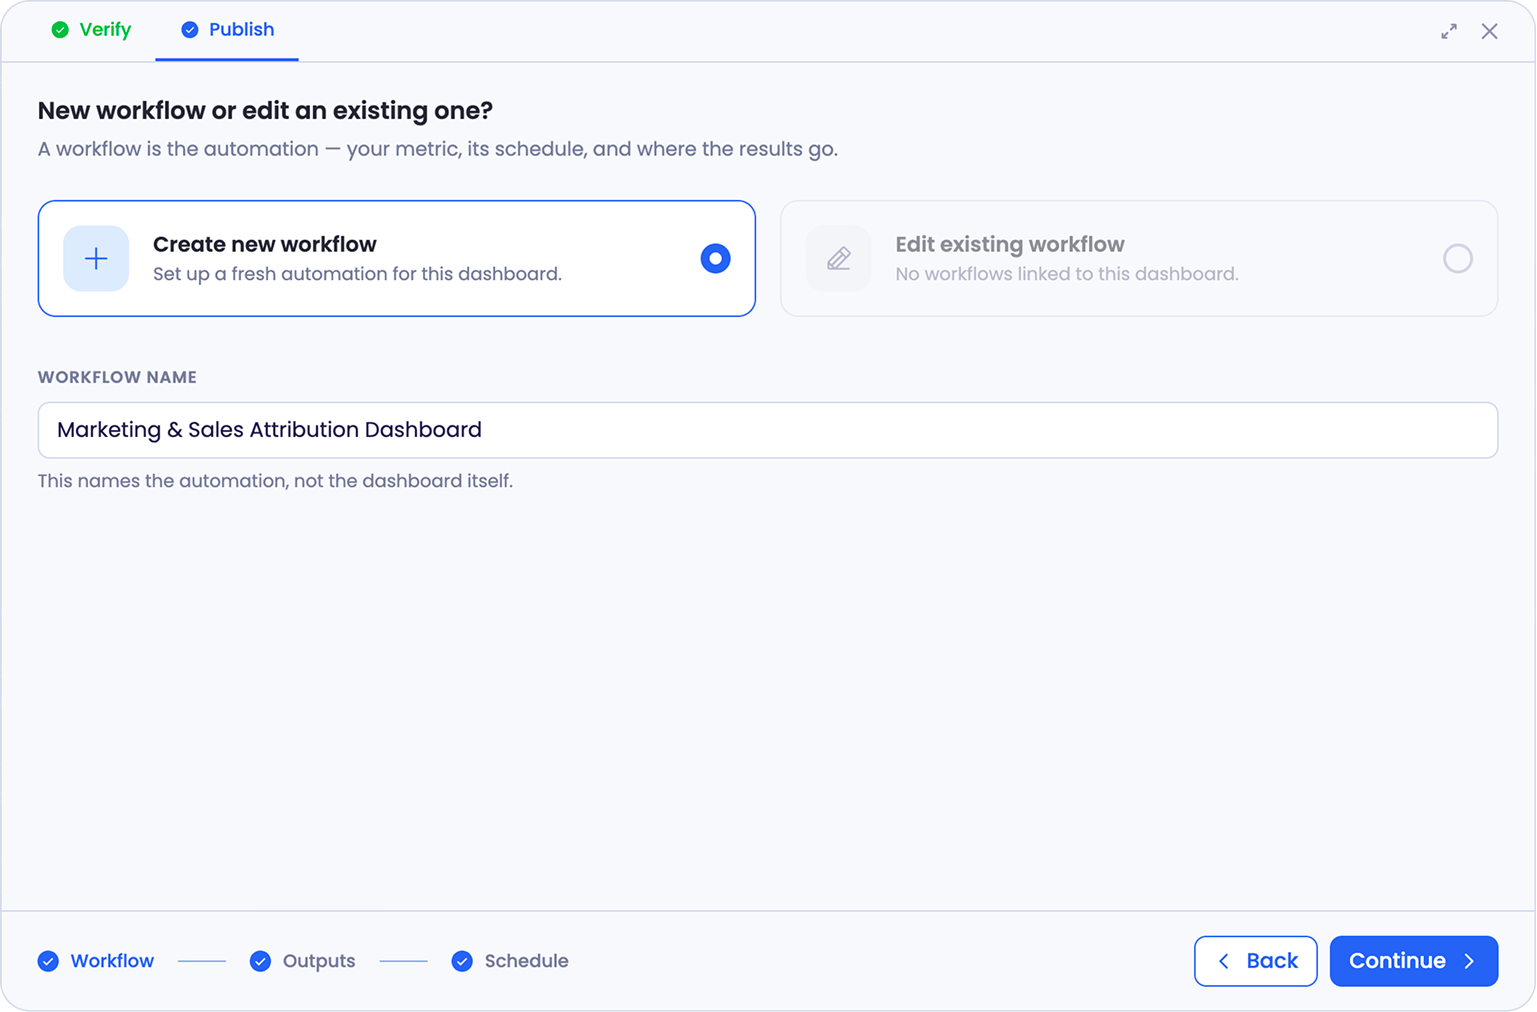
Step 1: Workflow
Because this is a new dashboard, you're setting up a new workflow to run behind it. Name it and continue. (The name is for the automation, not the dashboard itself.)
The workflow is the backbone. It's the engine underneath everything you publish: the sequence of analytical steps that turn your raw data into finished numbers, when those steps run, and where the results go.
Whatever you publish sits on top of the workflow as an action layer. A dashboard is one action layer. A Summary is another. So are CSV outputs, Slack alerts, and more to come. Because every one of them draws from the same workflow, a single set of calculations can power several outputs at once, and they all stay in sync. See Understanding Workflows for how the workflow runs, refreshes, and shows you every step behind your numbers.
The Edit existing workflow option stays greyed out here, since a brand-new dashboard has no workflow behind it yet. It comes into play later, when you edit a dashboard that already has one. That's where you decide whether to update the existing workflow or create a new one instead, so you don't change a workflow that other outputs may depend on.
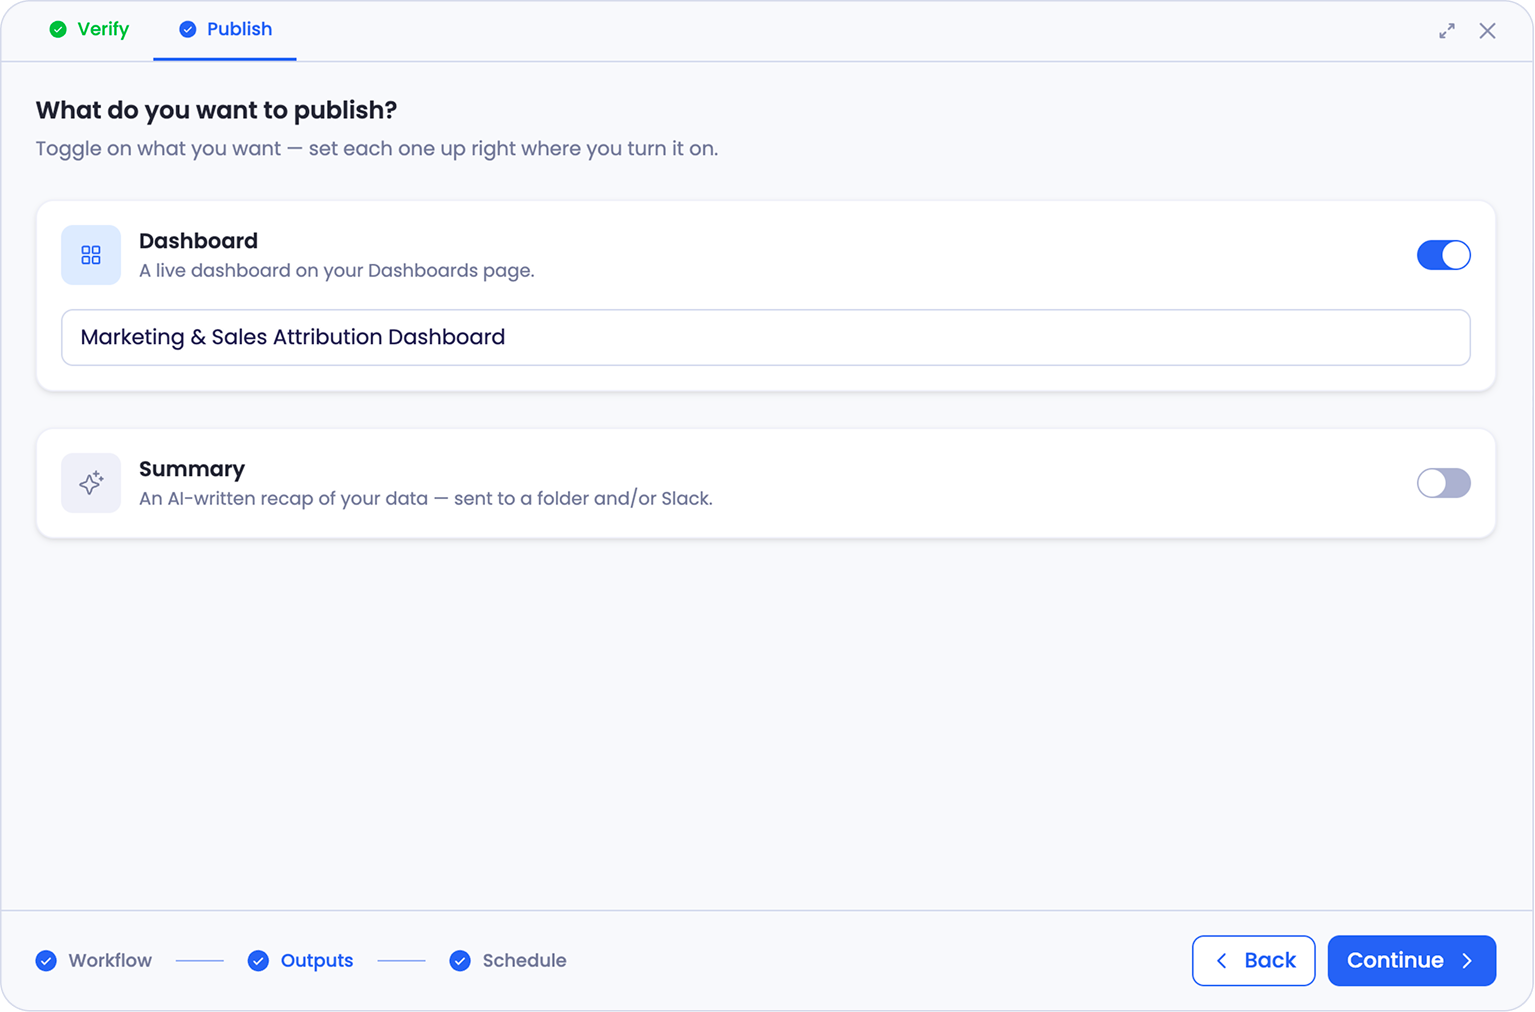
Step 2: Outputs
Pick what this workflow should produce. Turn on a Dashboard (a live dashboard on your Dashboards page), a Summary (an AI-written recap of your data, sent to a folder and/or Slack), or both. Each output is set up right where you turn it on. Because the same workflow can drive more than one output, a single set of numbers can power your dashboard and a written recap at once.
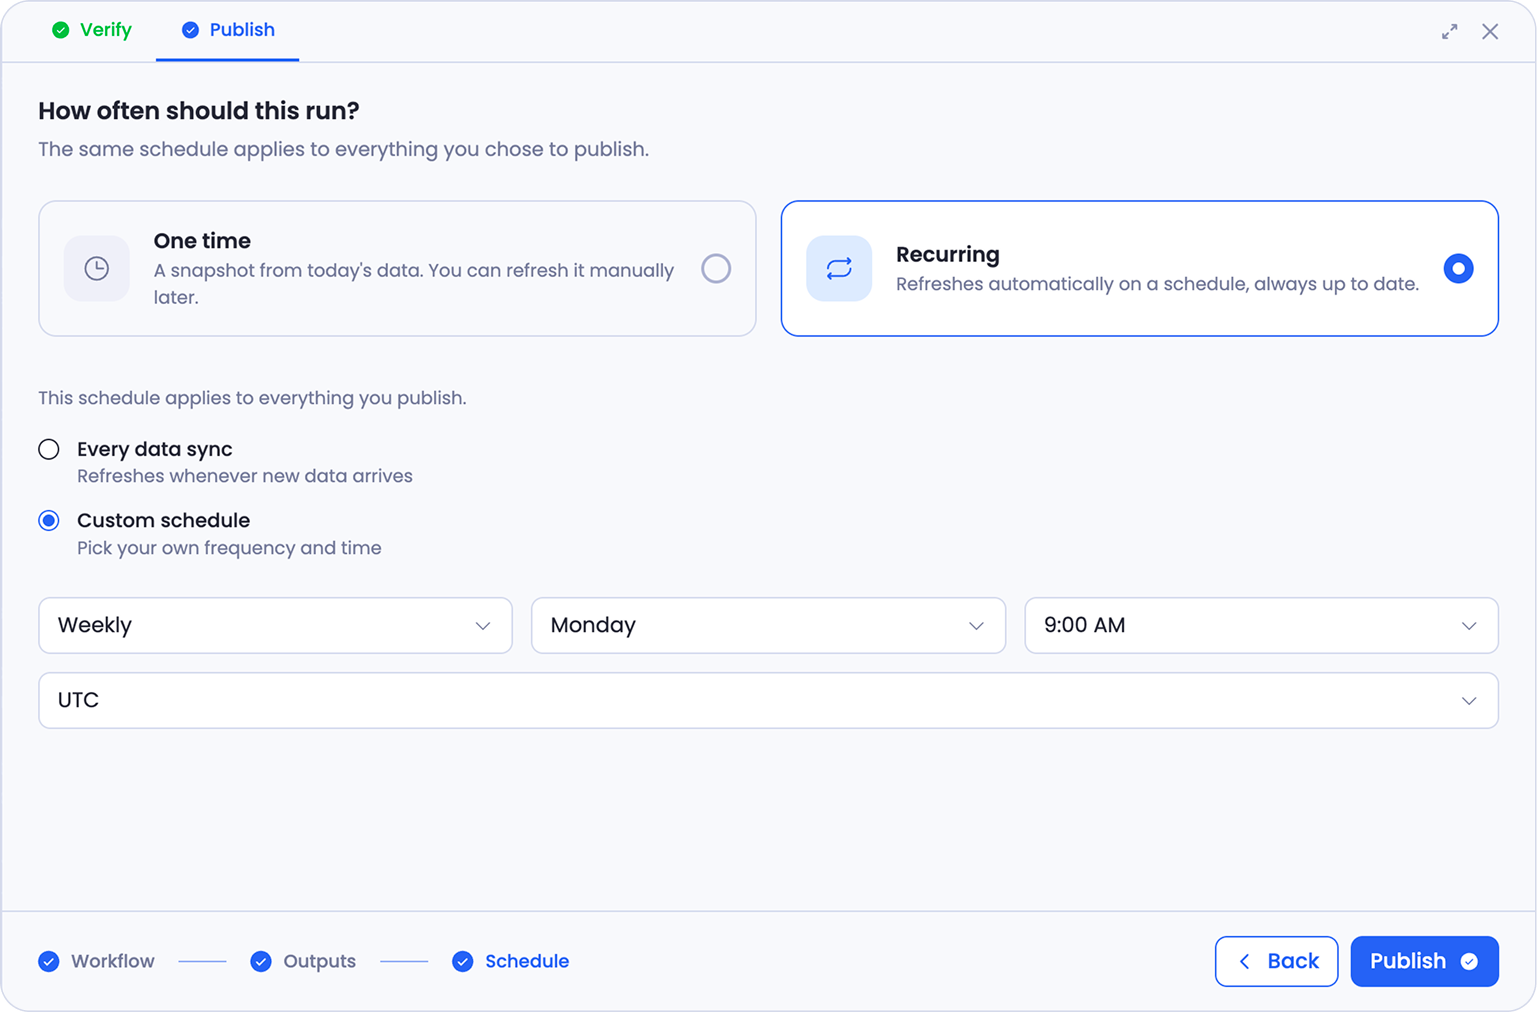
Step 3: Schedule
Decide how often it runs. One time publishes a snapshot from today's data that you can refresh manually later. Recurring keeps everything up to date automatically, either on every data sync or on a custom schedule you set, for example weekly on Monday at 9 AM. The schedule applies to everything you chose to publish.
Click Publish, and your dashboard goes live on your Dashboards page. If you set a recurring schedule, it refreshes on its own from then on.
Keep in Mind
Getting the best results from the AI
The AI workspace supports multiple types of output: dashboards, charts, reports, ad hoc analysis. Because of this flexibility, being specific in your prompts helps the AI understand exactly what you're looking for. For example, if you want a dashboard, mention "dashboard" in your request. If you want a one-time analysis or a summary report, say that. The more clearly you describe the output you have in mind, the faster the AI gets there, just like working with a new colleague who's sharp but still learning your vocabulary. A little back-and-forth in the early conversations is completely normal and part of the process.
Giving feedback on adjustments
The feedback chat on the adjustments page is specifically for the changes the AI made to prepare your dashboard for refresh. If a calculation looks wrong, a value seems off, or you want an adjustment handled differently, type your feedback, the AI re-processes the relevant step, and the adjustment updates. For changes to the dashboard itself (adding widgets, changing data sources, modifying layout), go back to the chat session.
Checking steps the AI didn't adjust
The adjustments page only shows steps the agent changed. If you want to review other steps (data queries, calculations, the full pipeline logic), go back to the Verify page. Each widget's "How it's built" panel shows the complete breakdown. You can then return to the Publish page to give feedback or continue with publishing.
When you go back to the Verify page from Publish and then return, remember to re-check your Publish page settings: which workflow you're updating (or if you're creating new), and how the schedule is set.
The preparation phase takes time
The AI reviews every step that goes into your dashboard. More steps means more time. This can take a few minutes for complex dashboards. You don't have to wait. You can close the page or navigate away, and the process continues in the background.
If you close or refresh during the review
Nothing is lost. The system keeps running in the background. When you return, you'll see the completed results. The progress view won't resume live from where you left. You'll see the final state instead.
We're building this with you
This is an early release and we're actively improving the experience. We've already planned UX improvements for the edit and navigation flows in upcoming releases. Your feedback directly shapes what we prioritize. The sooner you share it, the faster we can act on it.
Getting Help
If you have questions, run into issues, or want to share feedback on the experience, reach out to us directly at support@petavue.com. We're available and responsive. This is a collaborative process and your input matters.