Sage in Slack
Ask a question in Slack and get the answer back, without opening the product. Query your data straight from the app you already have open, and the answer comes to you where you already work.
What Is Sage?
Sage is Petavue itself, reachable from Slack. It's the same engine that powers your dashboards and analyses, available in a conversation.
You ask about your data in plain English. It queries your connected sources, works out the answer, and replies in the thread with the numbers, a chart where one helps, and what it all means. For anything you want to open properly or keep, it gives you a View in Petavue button.
No logging in, no tab switching, no waiting for someone to pull a number for you.
Getting Started
Open Petavue under Agents & apps in your Slack sidebar and say hello. You'll need to be a registered Petavue user for the agent to answer you.
If you don't see Petavue in your sidebar, Slack hasn't been connected yet. That's an admin task, done once for the whole organization. See Setting Up Slack.
Today you talk to the agent by direct message. Tagging it in a channel to ask a question isn't supported yet.
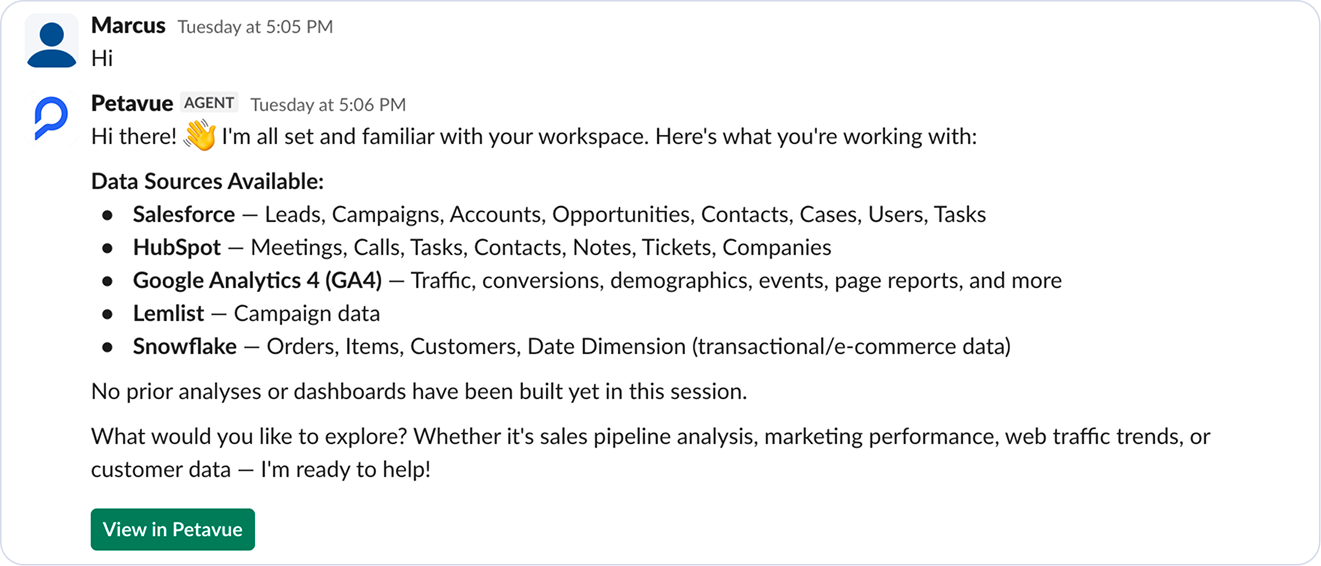
The agent opens by telling you what it's working with: every data source connected to your workspace, and the objects available in each. If your workspace has Salesforce, HubSpot, GA4, Lemlist, and Snowflake connected, it names all five and lists what it can reach in each, from Leads and Opportunities through to Orders and Customers.
It also tells you where you stand, noting whether any analyses or dashboards have been built in the session yet, and suggests places to start.
Asking a Question
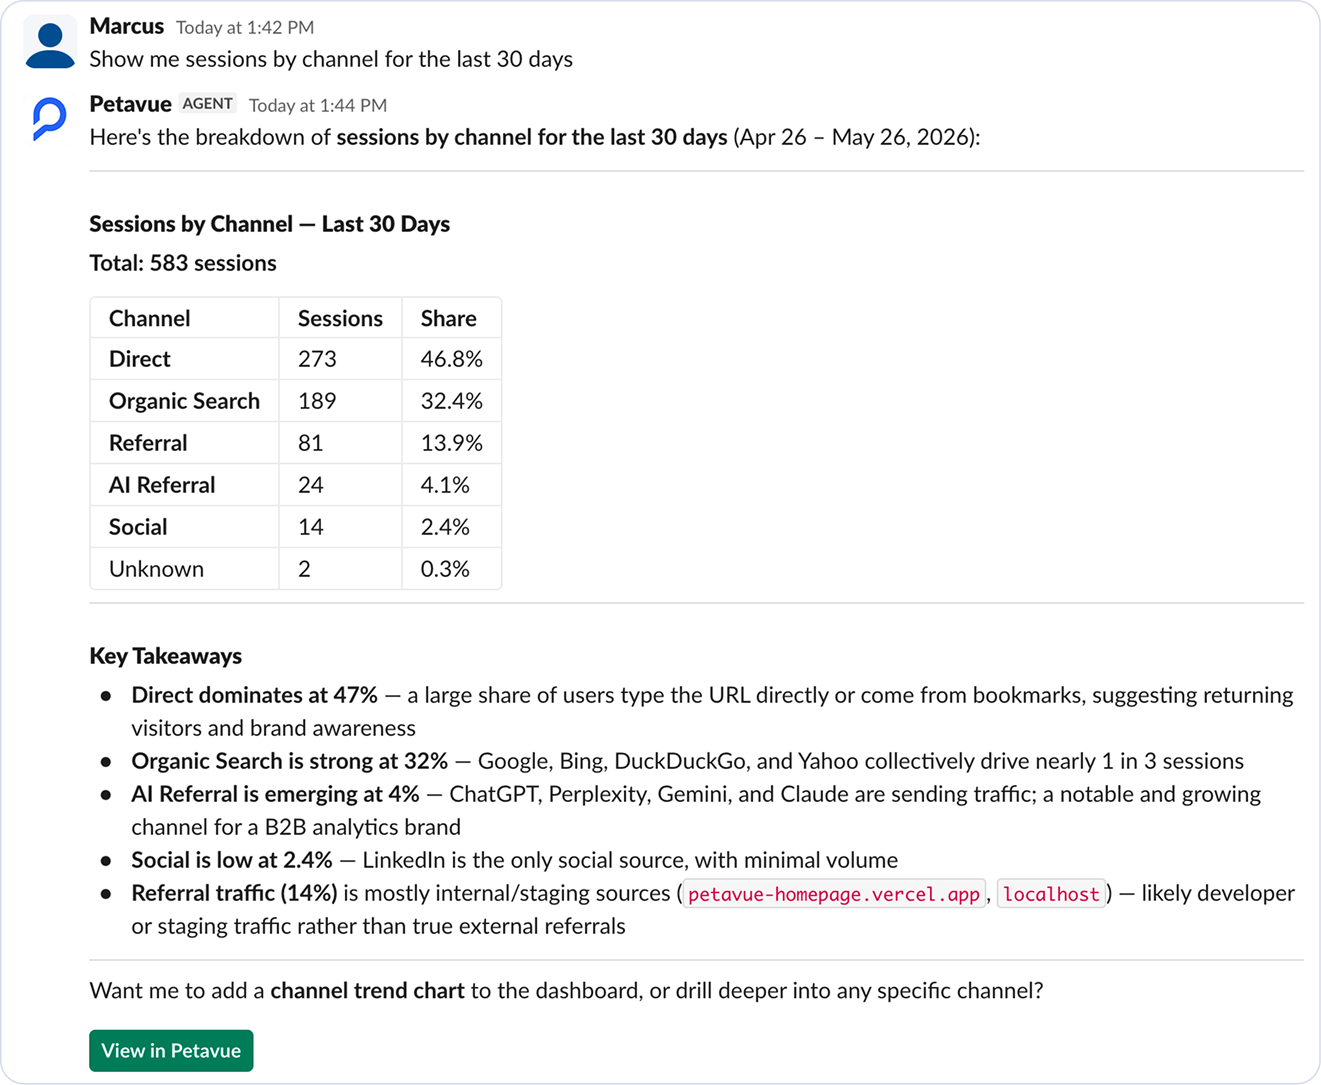
Type your question the way you'd ask a colleague. Something like "show me sessions by channel for the last 30 days" is enough.
The agent replies with a titled answer, the headline number, and a table of the breakdown. Then it adds Key Takeaways: rather than restating the table, it tells you what the numbers imply.
It closes by offering to go deeper, and gives you a View in Petavue button if you want to open the analysis properly.
Ask follow-ups in the same thread. The agent keeps the context of your conversation, so you can say "now break that down by device" without restating the question. That memory lasts for the conversation, not beyond it.
Charts in Slack
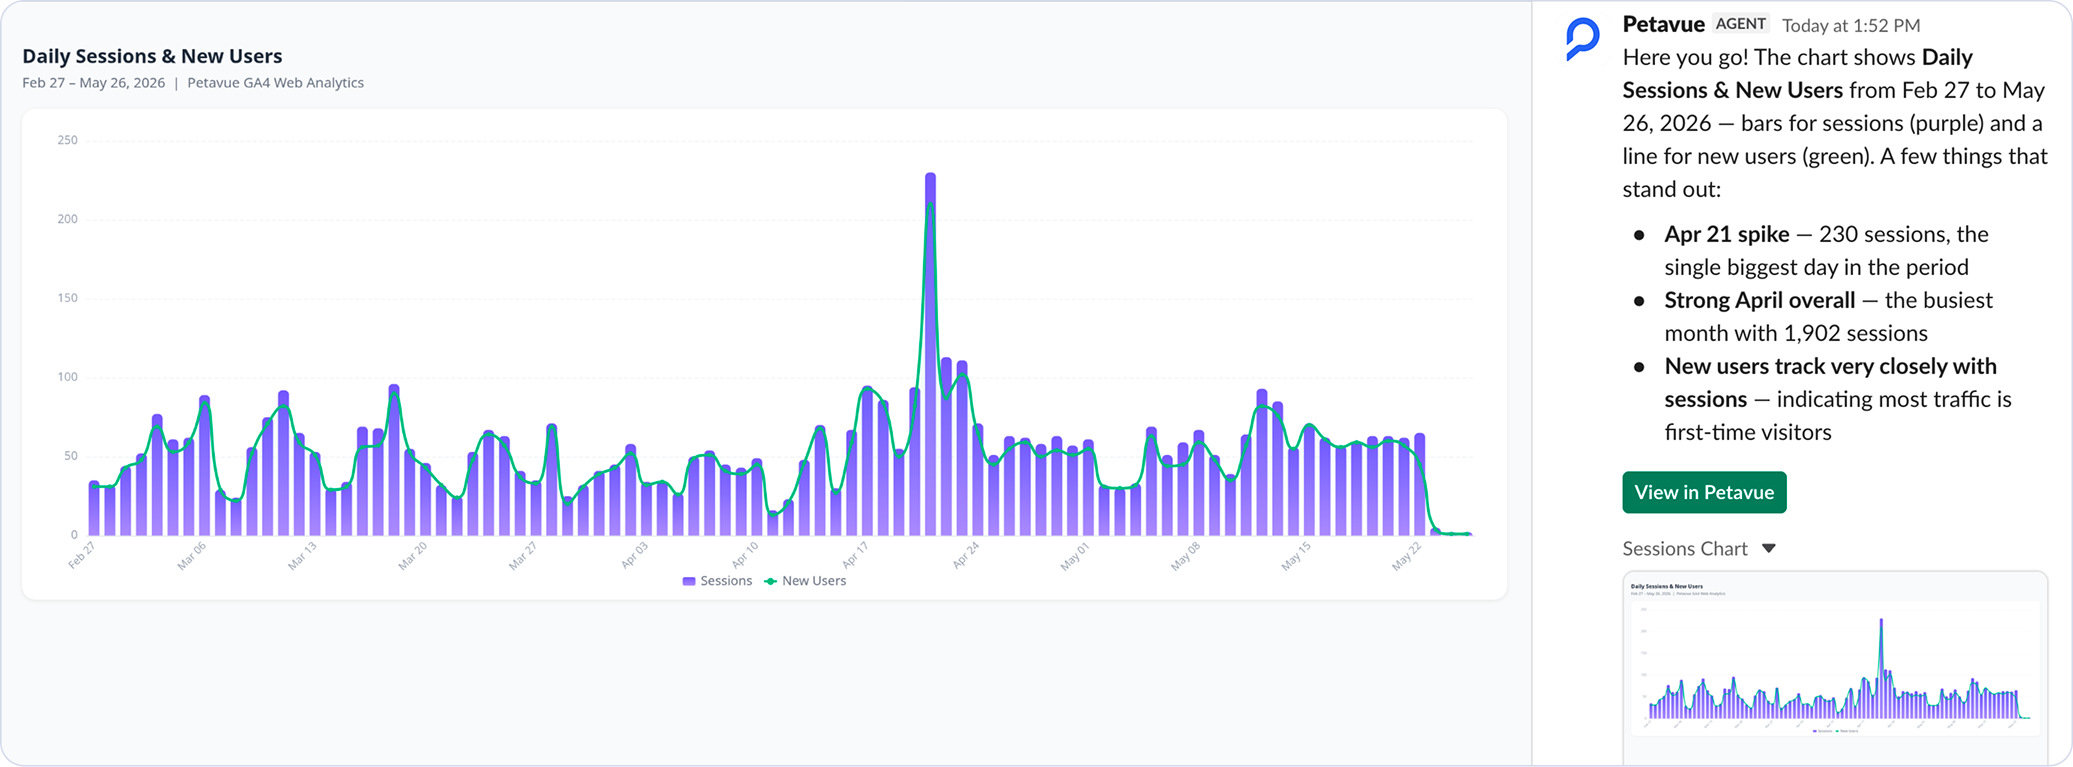
Ask for a chart and you get one, posted straight into the thread. Say "draw me a bar chart of revenue by month" or "show me any chart generated" and the agent replies with the chart as an image you can see without leaving Slack.
It doesn't just hand you the picture. Alongside the chart, it points out what's worth noticing: the single biggest day in the period, the busiest month, or the fact that new users track closely with sessions, which tells you most of your traffic is first-time visitors.
The image is a snapshot, so there's nothing to hover over or filter. When you want to interact with the data behind it, View in Petavue opens the real thing.
When Your Question Is Ambiguous
If a question could mean more than one thing, the agent asks rather than guesses.
Say your workspace has revenue in two places, transactional orders in your warehouse and deal revenue in your CRM. Ask for "revenue by month" and the agent will tell you both exist and ask which you meant, or whether you want both. You get a question back instead of a confident number built on the wrong table.
The same goes for words it doesn't know. Ask for a metric like "flurb rate" and it checks your saved definitions, tells you it isn't defined anywhere, and asks what it should mean. Once you explain, it can calculate it.
A number that quietly answers a different question than the one you asked is worse than no number.
Building a Dashboard from Slack
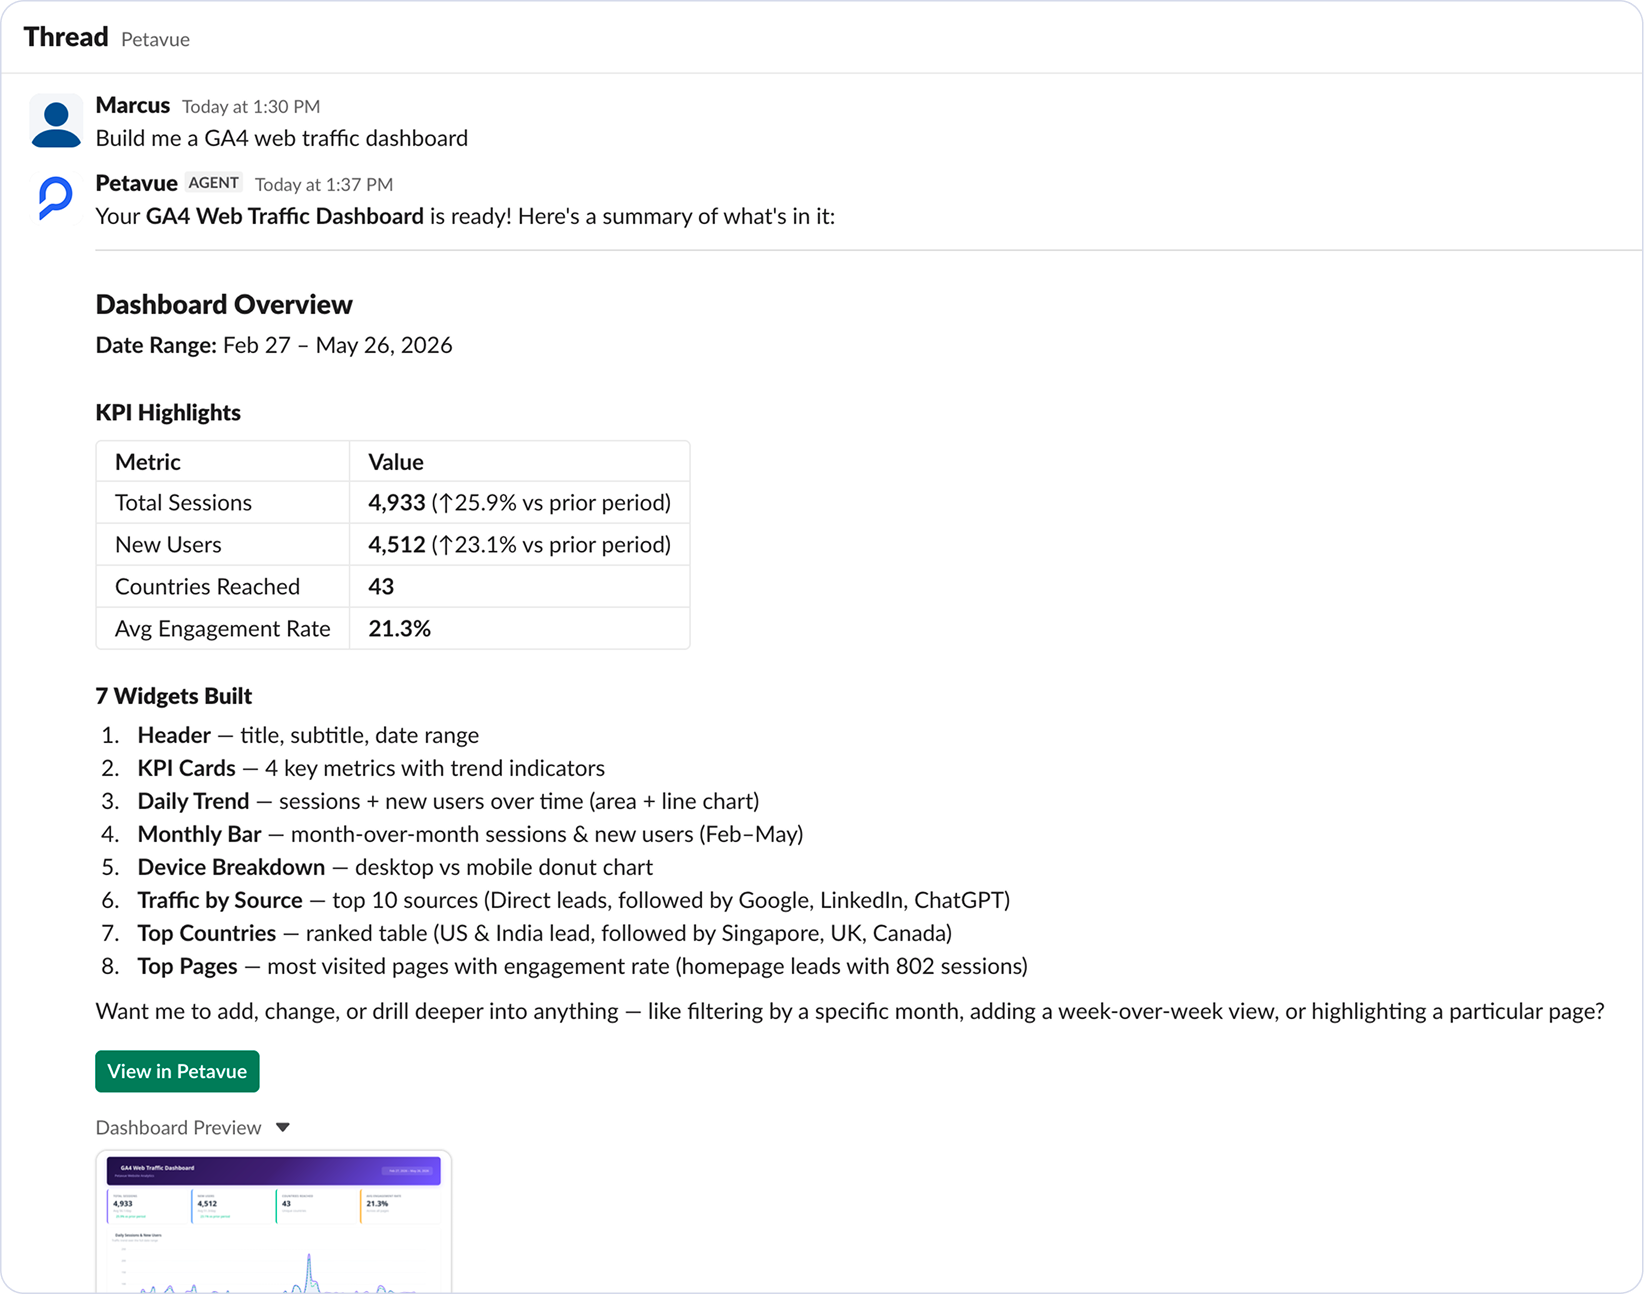
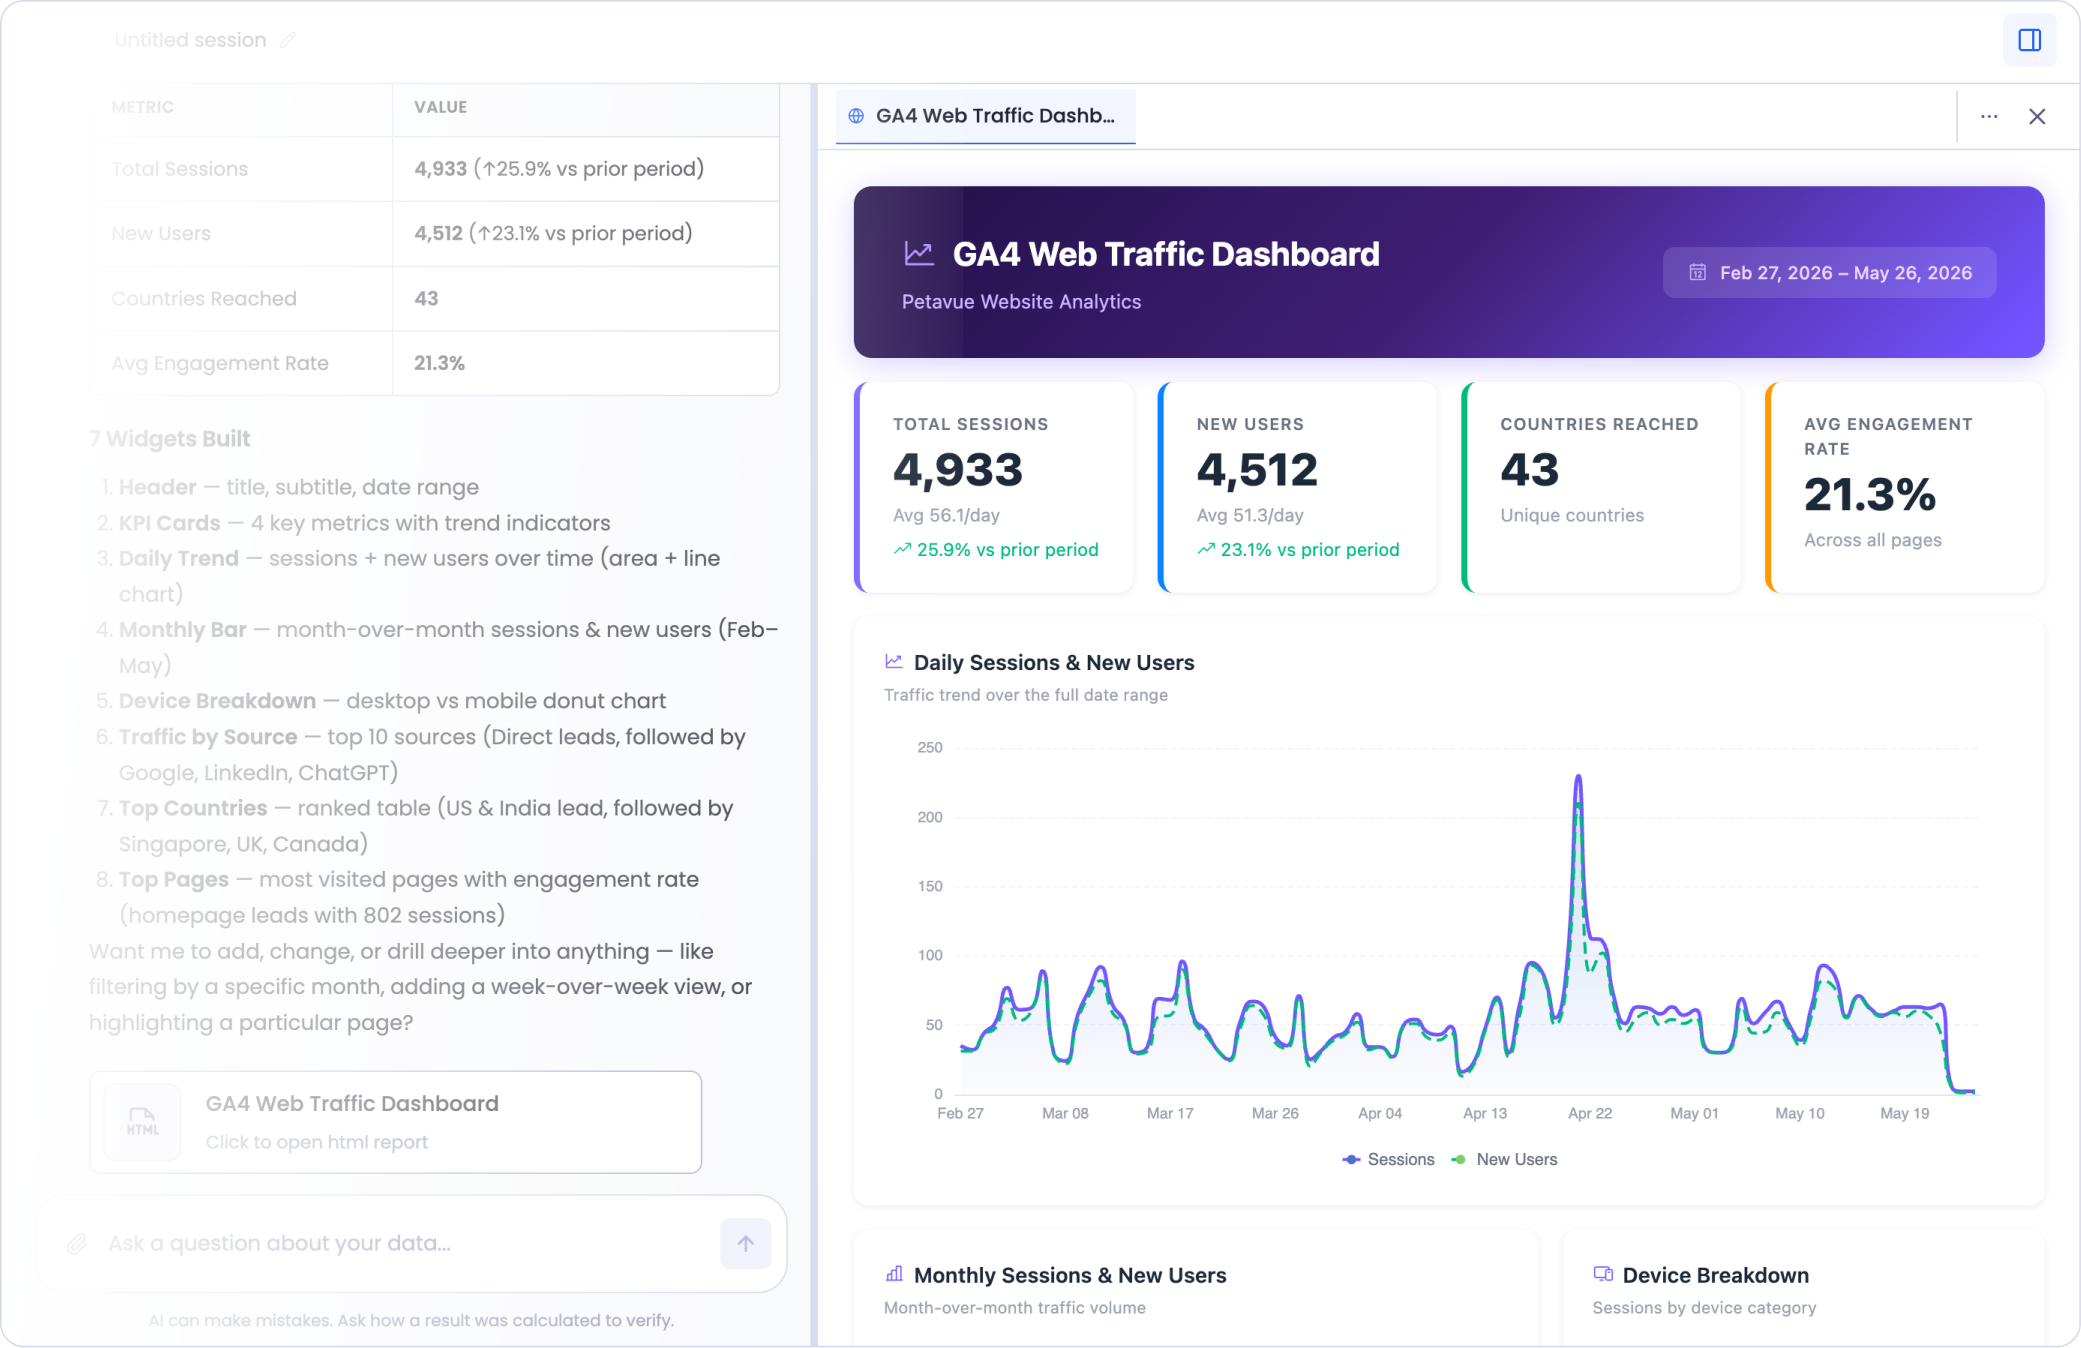
You can do more than ask questions. Tell the agent to build something, like "build me a GA4 web traffic dashboard," and it will.
Building takes longer than answering a question, so the agent tells you it's working before it starts. When it's done, it replies with:
- A Dashboard Overview, naming the date range it covers
- A KPI Highlights table with the headline metrics and how they moved against the prior period
- A list of the widgets it built, each described in a line
- An offer to add, change, or drill into anything
- A View in Petavue button
- A collapsible Dashboard Preview showing a thumbnail of the finished dashboard
The dashboard is real, not a mockup. Every number in it comes from a query against your data, and you can iterate on it right there in the thread: ask for another widget, a different date range, or a breakdown you forgot to mention.
Finishing it in Petavue
What the agent builds is a real dashboard, but it isn't published yet. Select View in Petavue and it opens in the app with Verify & Publish waiting, exactly like a dashboard you'd built in a session yourself.
That's the point where you check the work and decide it's trustworthy enough to share. Publishing verifies it, hardens it into a recipe, and lets you set a refresh schedule and add a Data Summary. See Building a Dashboard for the full flow.
So Slack does the building and the app does the publishing. You can go from a question in a chat to a live, scheduled dashboard without ever writing a query, but the decision to trust it stays yours.
What You Can Ask About
The agent reaches whatever your workspace has connected. Across sources, that typically covers:
- Pipeline and revenue questions from your CRM, such as stage distribution, win rates, deal velocity, and rep performance
- Marketing and outreach, including campaign performance, lead sources, and sequence results
- Web traffic, including channels, conversions, page performance, and audience breakdowns
- Orders and customers, including revenue trends, average order value, retention, and repeat purchase behavior
- Cross-source questions that tie sources together, such as following traffic through to leads and on to closed deals
- Your data itself, including what tables exist, what's in them, date ranges, and data quality issues like nulls or duplicates
If you're not sure whether something is answerable, ask. The agent will tell you what it can reach.
You can also ask it to export what it found. Say "export that as a CSV" and it prepares the file, tells you which columns and date range it covers, and gives you a View in Petavue button to download it.
Teaching It Your Definitions
Your team has its own language. What counts as a qualified lead, when your fiscal year starts, which deals count as won: the agent doesn't know any of it until you say so.
Tell it in conversation and it will use that straight away. Say your fiscal year starts in February and it applies from that point on.
To make a definition stick, save it. The agent will offer to save something to your context library, and once saved it persists across sessions and applies to future analyses. That's the difference between telling it something for now and teaching it something for good.
If you find yourself explaining the same rule twice, save it. Definitions in the context library mean everyone's answers use the same meaning of "win rate" instead of each person's interpretation.
Checking a Number
If you want to know where a number came from, ask. Say "is this right?" or "how did you get that?" and the agent shows its work.
You'll get the actual query it ran, the table it ran against, and the file it saved the result to. Nothing is summarized or paraphrased: it's the real lineage, from your data source through to the number in the chart.
It then tells you how to check it independently, which usually means some combination of:
- Inspecting the saved result file yourself and finding the row in question
- Cross-checking the figure in the source system directly, such as opening the same date in GA4
- Re-running the query yourself, since it gives you the exact SQL
It also flags anything that might trip you up in that particular answer, such as a table aggregating across every property you have connected rather than just the one you had in mind.
This is the fastest way to settle a disagreement about a number. Rather than arguing about whether a figure is right, ask the agent where it came from and check the source together.
Your History Is Kept
The agent has a History tab alongside the chat. It holds your past sessions, including any summaries or alerts that were delivered to you and the files that came with them, so you can go back to something you asked last week rather than asking again.
Slack or the App?
Slack handles the whole question: you ask, and the answer, the table, and the chart all come back in the thread. You rarely need to leave.
The difference isn't really about what each one can show you. It's about what each is for.
Asking in Slack is on-demand and conversational. You ask a question, get an answer, then drill in without rebuilding anything. "Now show me just mobile" works. You can ask things no dashboard has a widget for, and you can ask how a number was calculated. It suits investigation, the moment when someone asks why something moved and you want to find out now.
A published dashboard is always-on and shareable. Anyone with access can open it without asking anyone anything, and it refreshes on a schedule so the numbers stay current. It also travels further than the agent does: you can put a dashboard in front of your team or your CEO without them being registered Petavue users at all. It suits visibility, the numbers everyone should be able to check any time.
Most teams end up moving between the two: explore a question in Slack, publish what turns out to matter, then come back to Slack when the dashboard raises a new question.
When Something Goes Wrong
If the agent can't reach a source, it says so plainly and tells you what would fix it. Ask about a deal when your CRM connection has a permissions problem, and you'll get a clear explanation that the source is returning an error and that the connection's permissions need updating, rather than an empty answer or a number pulled from somewhere else.
It'll also offer to keep going with whatever it can still reach, so a broken connection doesn't block the rest of your question.
Who Can Use It
You need to be a registered Petavue user to talk to the agent. Being in the Slack workspace isn't enough on its own: if you're not registered, your question comes back with an unauthorized error rather than an answer.
Once you're through that gate, the agent doesn't distinguish between users. It sees the message, not the person: no name, no role, no permission level. That has a practical consequence worth understanding before you roll it out to your team.
The agent applies no access control of its own. If a table is reachable from your workspace, the agent will query it for any registered user who asks, and it can't tailor answers by role or seniority. Access is best enforced at the data source, using your warehouse's own permissions, rather than relying on the agent to gatekeep. Queries do run through your connected warehouse, so any access logging you have there still applies.
Keep in Mind
Ask by direct message. Conversations happen in a direct message with the agent. Tagging it in a channel to ask a question isn't supported yet.
Channel messages are simpler. A Summary delivered to a channel arrives as plain text rather than a fully formatted table, and you can't ask follow-ups from it. In a direct message you get the full formatting, and follow-ups work. Selecting a follow-up opens it in Sage in Petavue.
Memory ends with the conversation. The agent remembers everything within a conversation, but starts fresh in a new one. Anything you want to carry forward should be saved to your context library, and anything you want to keep should be exported or published.
Traceable isn't the same as verified. Every number traces back to a query you can inspect and re-run, which is what makes an answer checkable. Verification is a separate step: it happens when you publish, and it's what hardens a dashboard into a recipe others can rely on. Anything the agent builds, including a dashboard, is waiting on that step until you open it in Petavue and publish it. See Understanding Workflows.
It reads, it doesn't write. All queries are read-only. The agent can only run SELECT queries, and write, delete, and drop operations are blocked entirely. Changing anything in your warehouse has to be done there directly.
It answers data questions. The agent stays in the analytics domain. Ask it something outside your data and it'll tell you that's not what it does, and point you somewhere better.
Numbers are as fresh as your last sync. The agent works with whatever is in your connected sources at sync time, not live from the source system.
Downloads happen in Petavue. The agent can produce a CSV and tell you what's in it, but the file itself is downloaded from Petavue rather than attached in Slack.
It won't trigger anything. The agent analyzes and builds. It doesn't send emails or fire off workflows on your behalf.
Getting Help
If you have questions, run into issues, or want to share feedback on the experience, reach out to us directly at support@petavue.com. We're available and responsive, and your input matters.