History Folder
Your data has a memory now. Every scheduled run of your workflow is saved, so you can see where a number is today, where it was last week, and find out what moved it.
What Is the History Folder?
Most tools show you what's true right now and quietly forget the rest. Petavue keeps every version.
Each time your workflow runs on its schedule, it saves a snapshot: the data it pulled, the outputs it produced, and the logic it used. Nothing is overwritten. Instead of one dashboard that changes under you, you get a record of every state that dashboard has been in.
That's what turns "pipeline is $4.1M" into something you can interrogate. You can see what it was before, and ask why it isn't that anymore.
Why It Matters
A dashboard tells you where a number stands today. It rarely tells you the thing you actually want to know, which is whether that's better or worse than before, and what moved it.
History closes that gap. Because every scheduled run is kept, the comparison to last week or last quarter is always available, and it's drawn from the exact data captured at the time rather than estimated backwards from today. That's the difference between "pipeline is $4.1M" and "pipeline is $4.1M, up from $3.6M three weeks ago, and here's what drove it."
Where to Find It
- Open a published dashboard.
- Launch Sage.
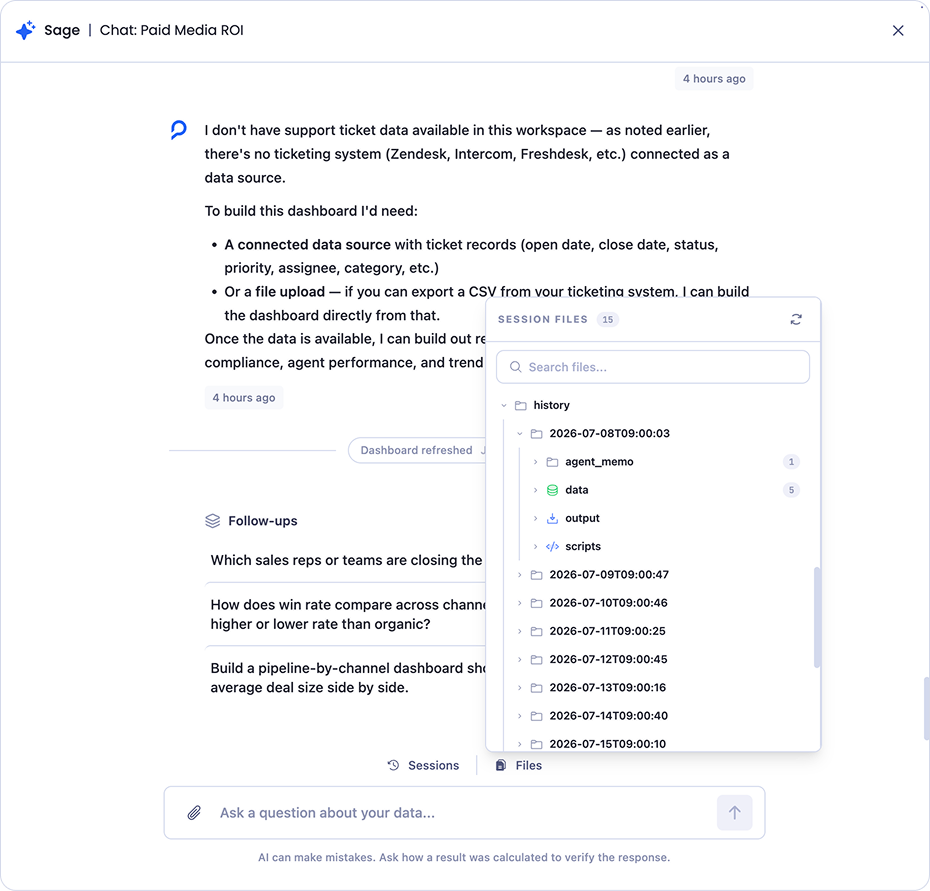
- Select Files at the bottom of the panel.
- Expand the history folder.
Each run is stored in its own folder, named for the moment it ran.
What's in a Snapshot
Every timestamped folder holds the complete state of your dashboard at that moment, in three parts:
data contains the source datasets the run pulled, as CSVs. These are the raw numbers everything else was built from.
output contains what the run produced, including the dashboard data and any other artifacts.
scripts contains the processing logic that turned the data into the output.
Together they're a full record, not a summary. You can open the CSVs and read the exact rows behind a number from three weeks ago.
Asking Sage About Time
This is where history earns its place. Open Sage on a dashboard that's built up a few snapshots, and you can ask it questions that only make sense across time. It reads the past runs and answers on the spot, without you opening a single file.
Three kinds of questions work particularly well.
Point-in-time comparisons
Pin two moments against each other.
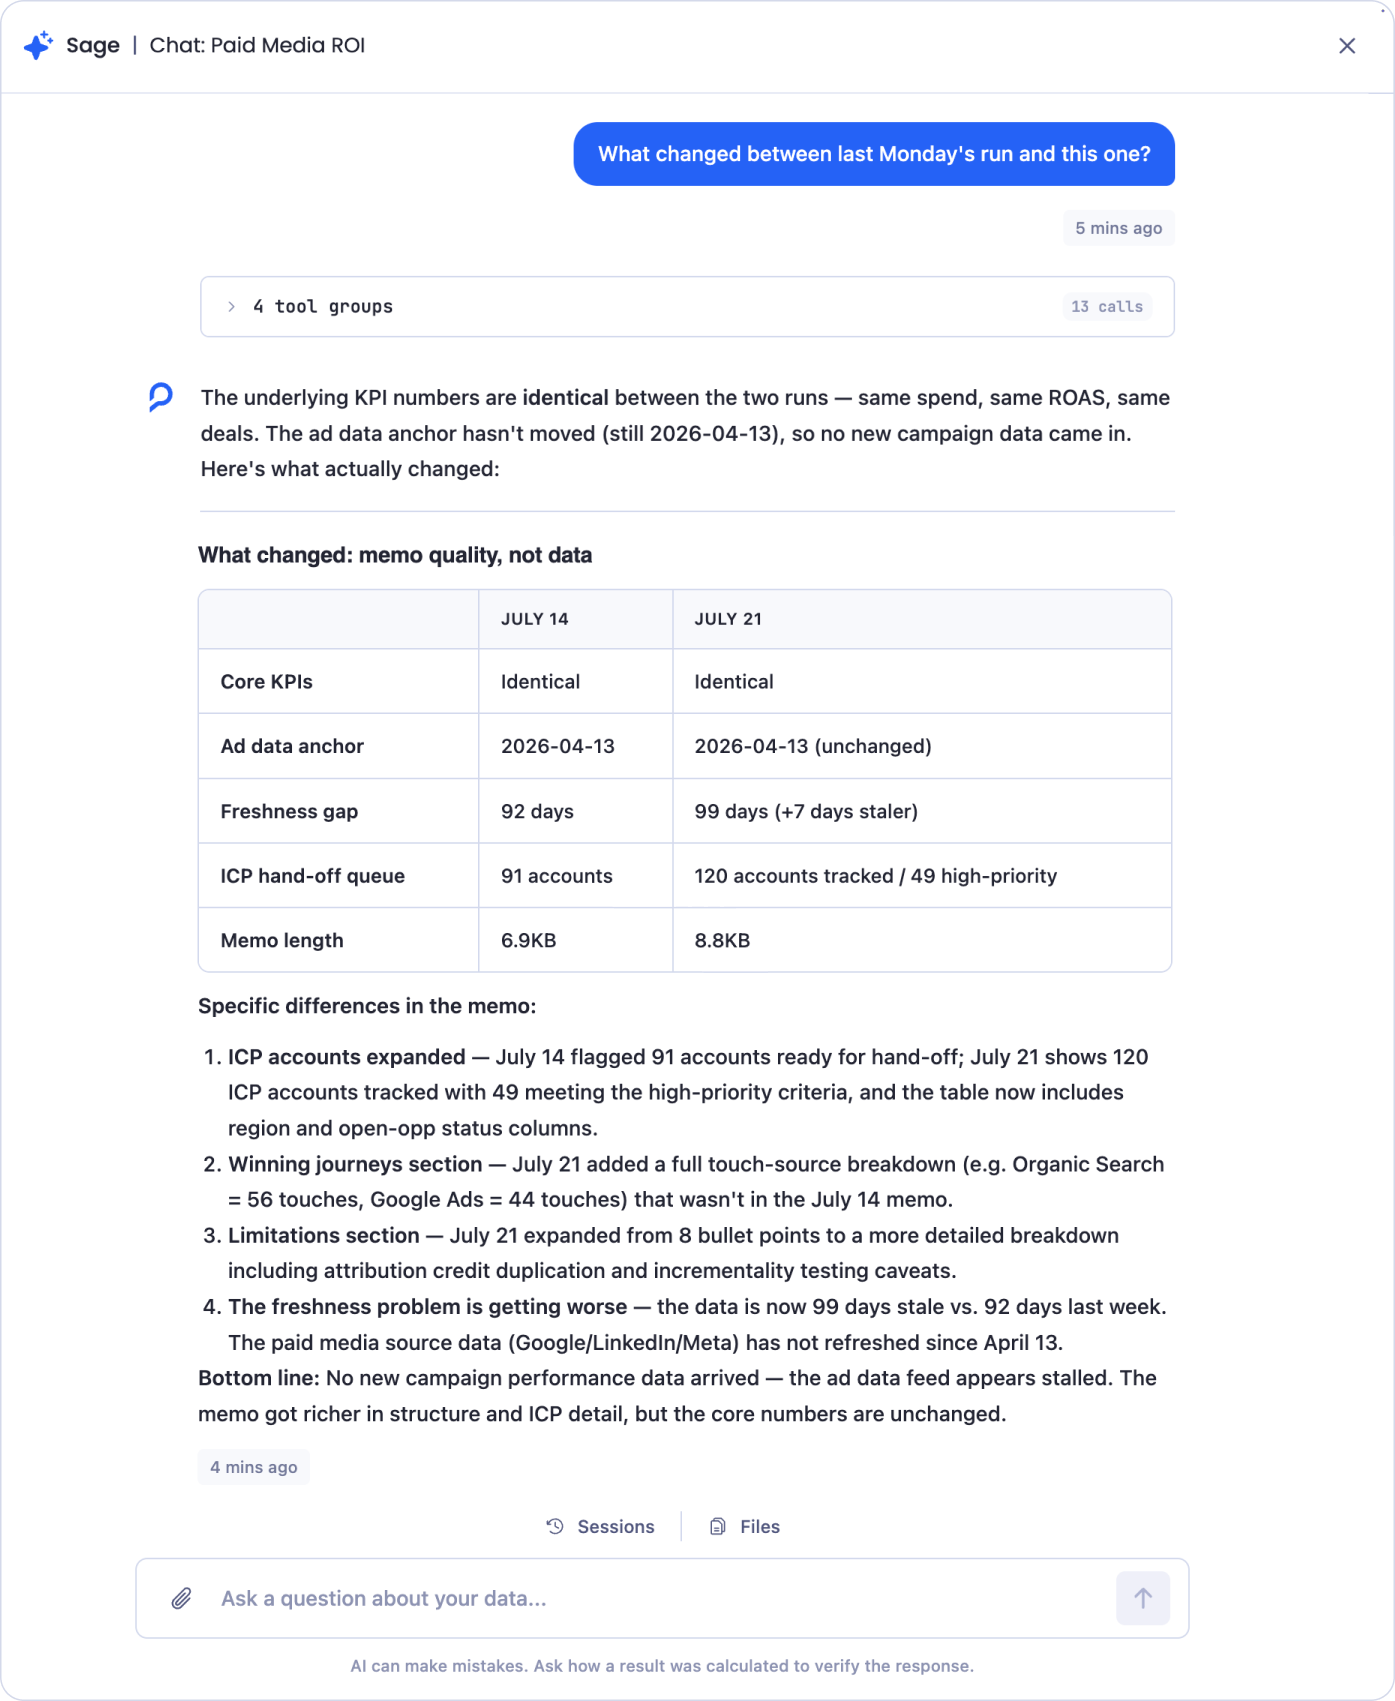
- "What changed between last Monday's run and this one?"
- "How does pipeline today compare to the start of the quarter?"
- "Did cost per lead move after we paused the LinkedIn campaign?"
Sage finds the two relevant snapshots, lines them up, and tells you what shifted and by how much. The useful part is that it can tell "the numbers moved" apart from "the numbers held but the data got staler." Ask what changed since last Monday and it might report that your core KPIs are identical between the two runs, but flag that the underlying data is now a week staler because a source hasn't refreshed, something a single snapshot would never show you.
Trends over time
Follow a number across many runs.
- "How has marketing-influenced pipeline moved over the last eight weeks?"
- "Show me the trend in demo bookings since March."
- "Is our win rate climbing or flat this quarter?"
Rather than a single before-and-after, Sage reads the run of snapshots in order and describes the shape: rising, falling, spiking, or holding steady.
What moved most
Let Sage find the story rather than naming the metric yourself.
- "Which KPI changed the most this month?"
- "What's the biggest mover since our last board update?"
- "Where did we gain and where did we slip this week?"
Sage compares across snapshots and surfaces the metrics that shifted furthest, so you're not the one hunting for what's worth noticing.
How Sage Answers
When you ask a time-based question, Sage reaches for your history folder first. The snapshots are already there, captured at the moment each run happened, so it can compare them directly instead of rebuilding the past from scratch. That makes the answer fast, and it means the comparison reflects exactly what the dashboard showed then, not a reconstruction of it.
If your question reaches further back than your snapshots go, Sage fills the gap by querying your data source for the missing stretch. Ask for eight weeks when you've only got three weekly snapshots, and it uses the three it has and pulls the rest from your warehouse. You still get the answer; the part that comes from history just arrives quicker and carries the certainty of having been captured at the time.
Either way, you can ask Sage where a number came from, and it will tell you which snapshot or query it used. See Meet Sage for more on how Sage shows its work.
When Snapshots Are Created
A snapshot is created on each scheduled run of your workflow.
This is worth knowing, because it means your history is a product of your refresh schedule. A dashboard set to refresh every Monday builds a weekly record of itself without anyone doing anything. A dashboard with no schedule has nothing to compare against, however often you refresh it by hand.
If history matters for a dashboard, put it on a schedule. See Understanding Workflows for how refresh schedules work.
Running a workflow manually with Run Now updates your dashboard but doesn't add a snapshot. Only scheduled runs are recorded in history.
Keep in Mind
Snapshots aren't overwritten. Each scheduled run is stored independently, so your record gets longer over time rather than being replaced.
History depends on a schedule. No schedule means no snapshots, and no way to answer what changed. Manual runs don't count.
Deeper history needs more runs. Sage can only compare against snapshots that exist. If you ask for a longer stretch than you've captured, it fills the rest by querying your data source, so the answer still arrives, but the further back you want to go reliably, the longer the dashboard needs to have been running on a schedule.
Your history is your own. History snapshots belong to the dashboard's owner. Sharing a dashboard is a separate step and doesn't hand over its history.
It isn't Run History. The Run History section on the Workflows page logs that a run happened, with its status and duration. The History folder holds what that run produced. One tells you the workflow completed; the other tells you what the numbers were.
Getting Help
If you have questions, run into issues, or want to share feedback on the experience, reach out to us directly at support@petavue.com. We're available and responsive, and your input matters.