Using Sage on a Dashboard
Every published dashboard has Sage built in. Open it from the dashboard and you can ask how any number was produced, drill into a single widget, or take the analysis further, all without leaving the page.
The Same Sage, on Your Dashboard
This is the same Sage you use in the main workspace and in Slack. What changes is where it opens and what it starts with. Launch it from a published dashboard and it opens already knowing that dashboard: its widgets, its numbers, and the full lineage of how each was built.
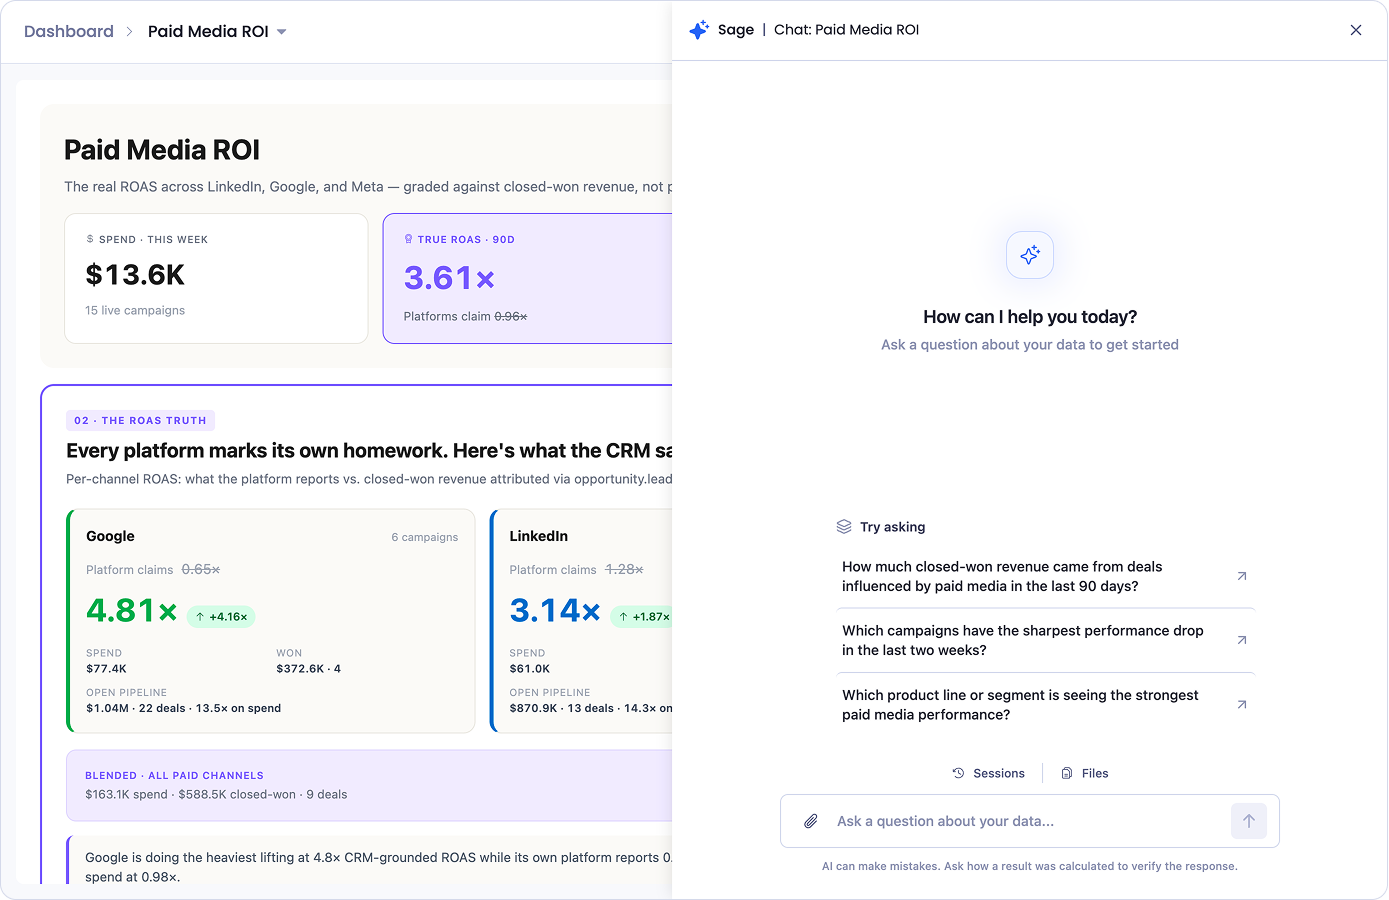
Open it with the Sage button in the dashboard header. The panel opens beside your dashboard, headed with the dashboard's name, and suggests a few questions to get you started.
Trace How a Number Was Built
The dashboard comes with its own lineage. In the Sage panel, open Files and you'll find lineage.md, a written record of how the dashboard was built: the queries, calculations, and transformations behind every widget. It sits alongside the other context Sage works from, including the definitions and rules that shaped the numbers, all searchable in one place.
You can read the lineage directly, or let Sage read it for you. Ask "how was True ROAS calculated?" and Sage answers from the lineage, walking you through the logic that produced the number. You can name the file if you want to be explicit ("using lineage.md, how was this built?"), but you don't have to. Sage reaches for it on its own.
This is what makes a published number something you can stand behind. When someone asks where a figure came from, you don't have to guess or go digging. The answer is one question away, traced back to the source.
lineage.md is also the file you'd download if you wanted to rebuild this dashboard in a fresh session. See Reusing a Published Dashboard.
Drill Into the Dashboard
Sage works here the same way it does in the main workspace, with one difference: it already has this dashboard as context. That lets you drill in two ways.
Ask about the dashboard as a whole. "Which channel is driving the most closed-won revenue?" or "What has changed since the last refresh?" draws on everything the dashboard covers.
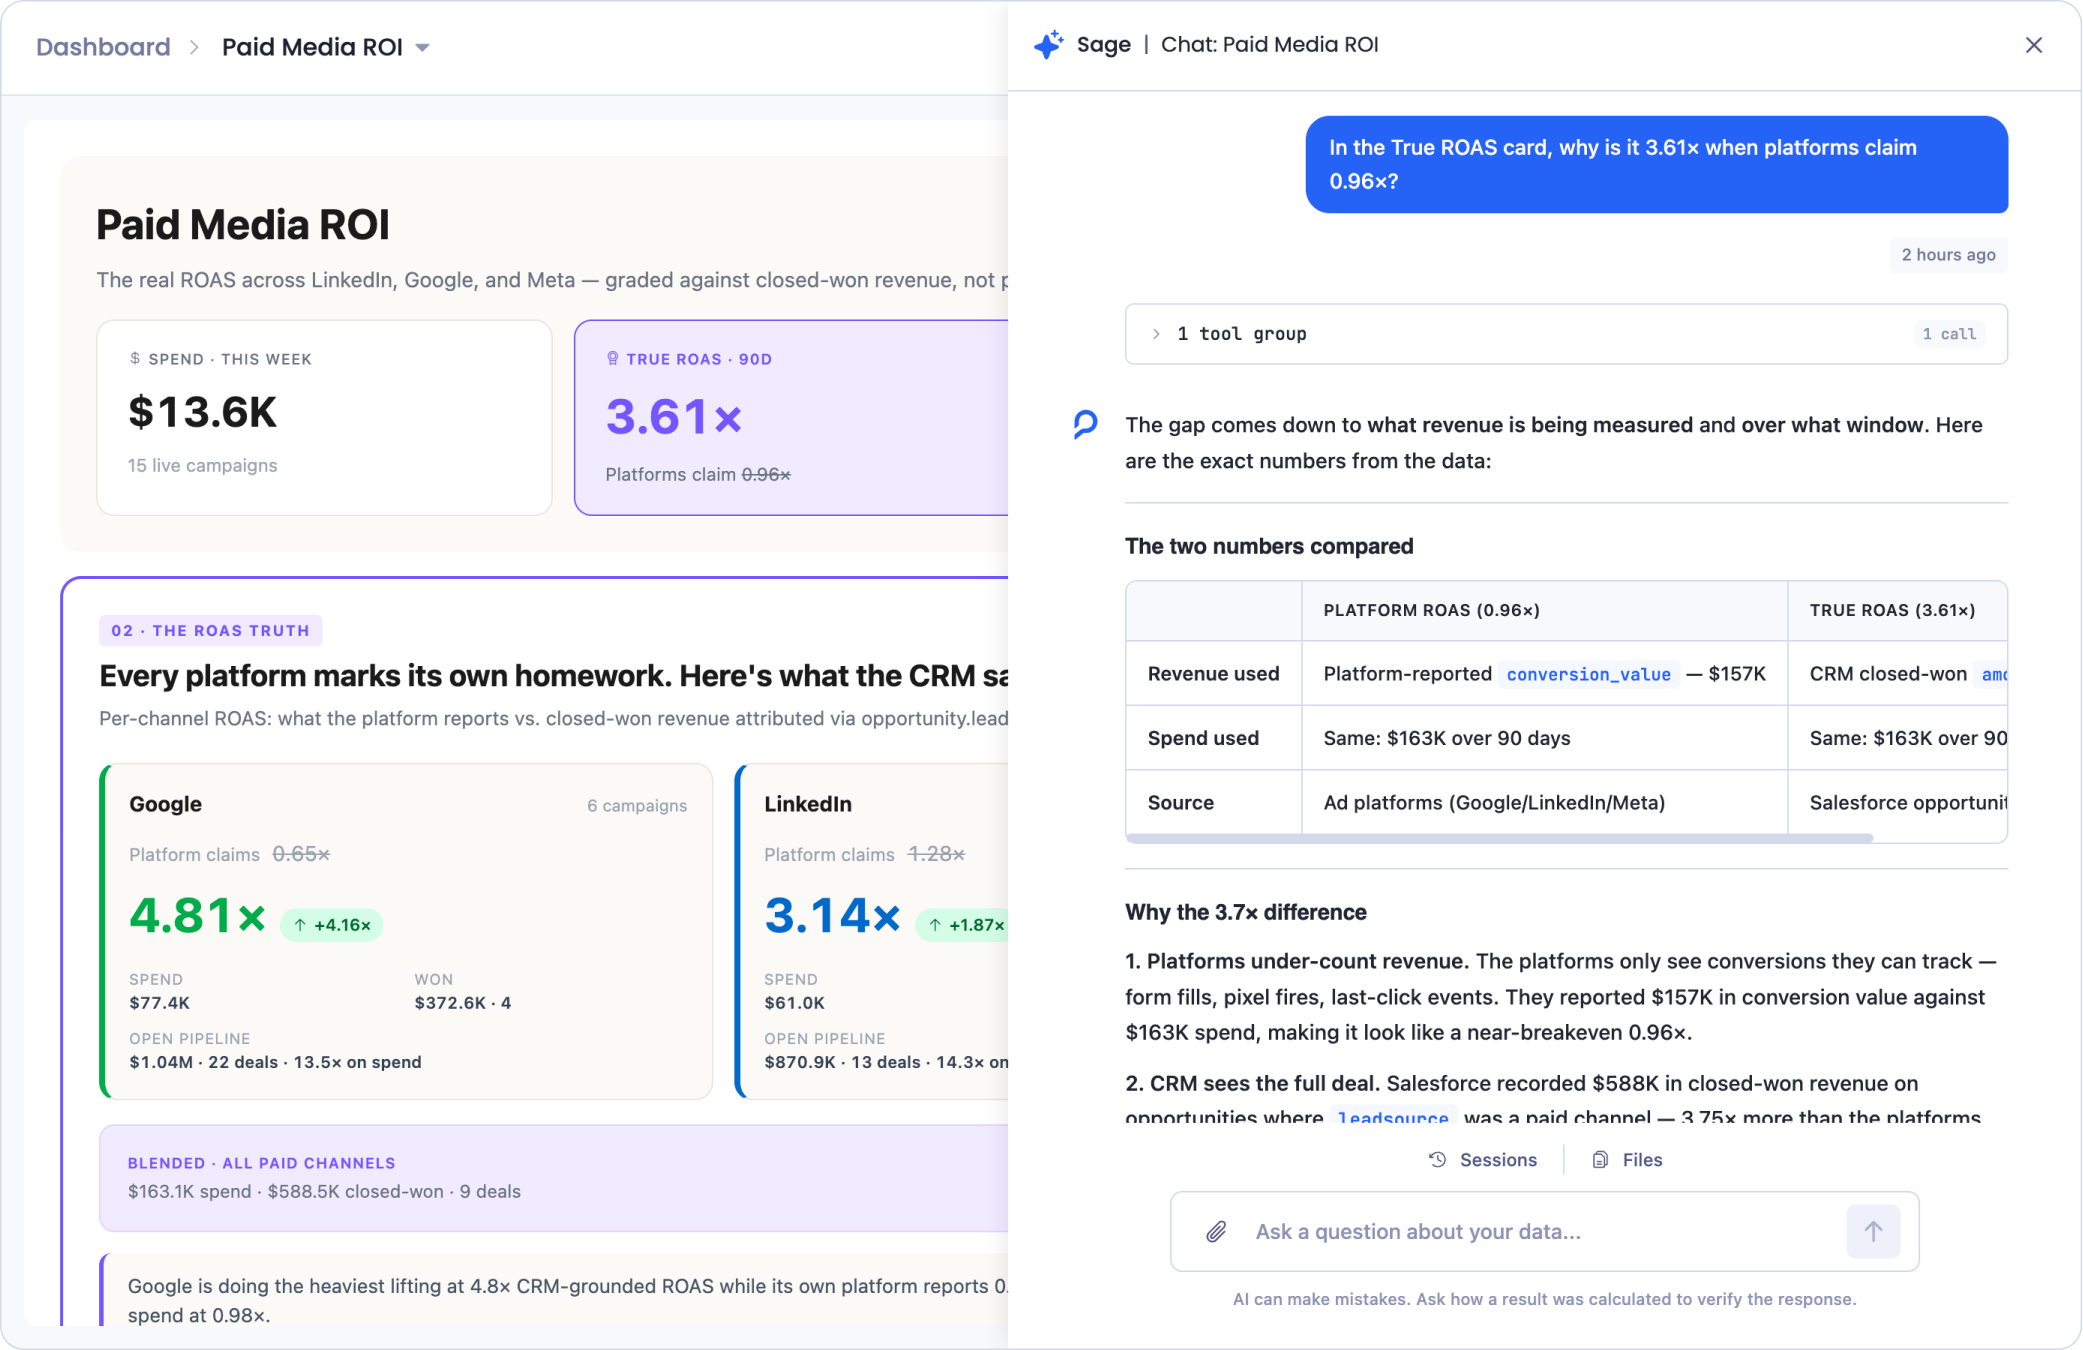
Ask about one widget. Quote or name a specific card and Sage scopes to it. Ask "in the True ROAS card, why is it 3.61× when the platforms claim 0.96×?" and it explains that one number, using the same logic that built it. As with the main workspace, it offers a few follow-up questions to take the thread further.
You can also change the dashboard from here, not just ask about it. Because Sage already has this dashboard as context, it's the right place to adjust or extend it: describe the change you want and it works from the dashboard's own logic, without you re-explaining how it was built. To reproduce a dashboard in a fresh session instead, see Reusing a Published Dashboard.
Either way, you're not limited to the numbers already on screen. Because Sage keeps your wider workspace in reach, you can go past what the dashboard shows. Ask for the best-performing channel and it can weigh pipeline from your CRM, paid ROAS from this dashboard, and web traffic from your analytics together, in one answer.
Pick Up Where You Left Off
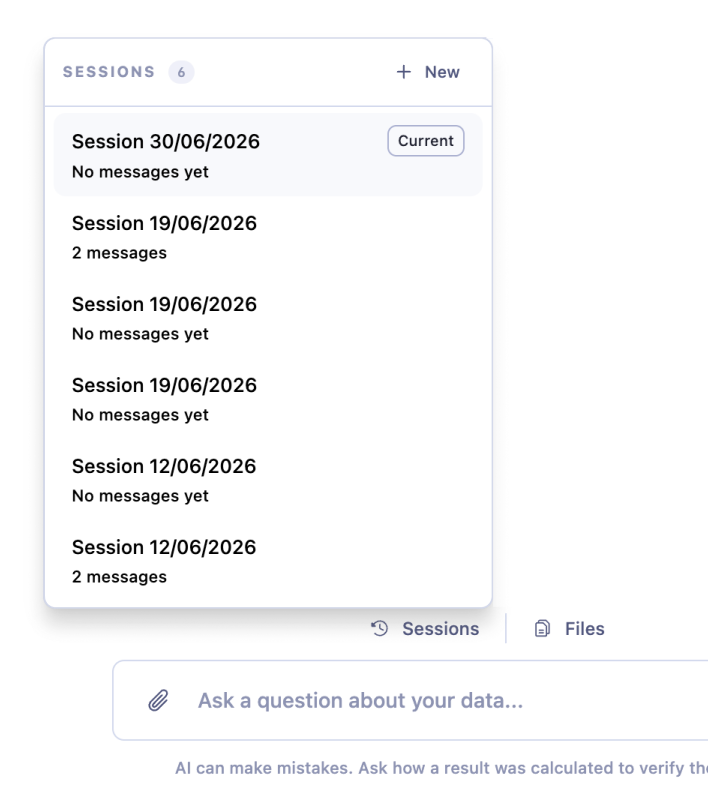
Your conversations here are saved. Open Sessions in the panel to see past chats on this dashboard, each showing when it happened and how many messages it holds, with the current one marked. Select one to carry on where you stopped, or start a fresh thread with New.
This means a line of investigation doesn't vanish when you close the panel. The question you asked last week, and the answer Sage gave, are still there to pick back up.
What Sage Can Reach
The dashboard is where Sage starts, not where it stops. It can see your connected sources, so a question that goes beyond the dashboard is still fair game.
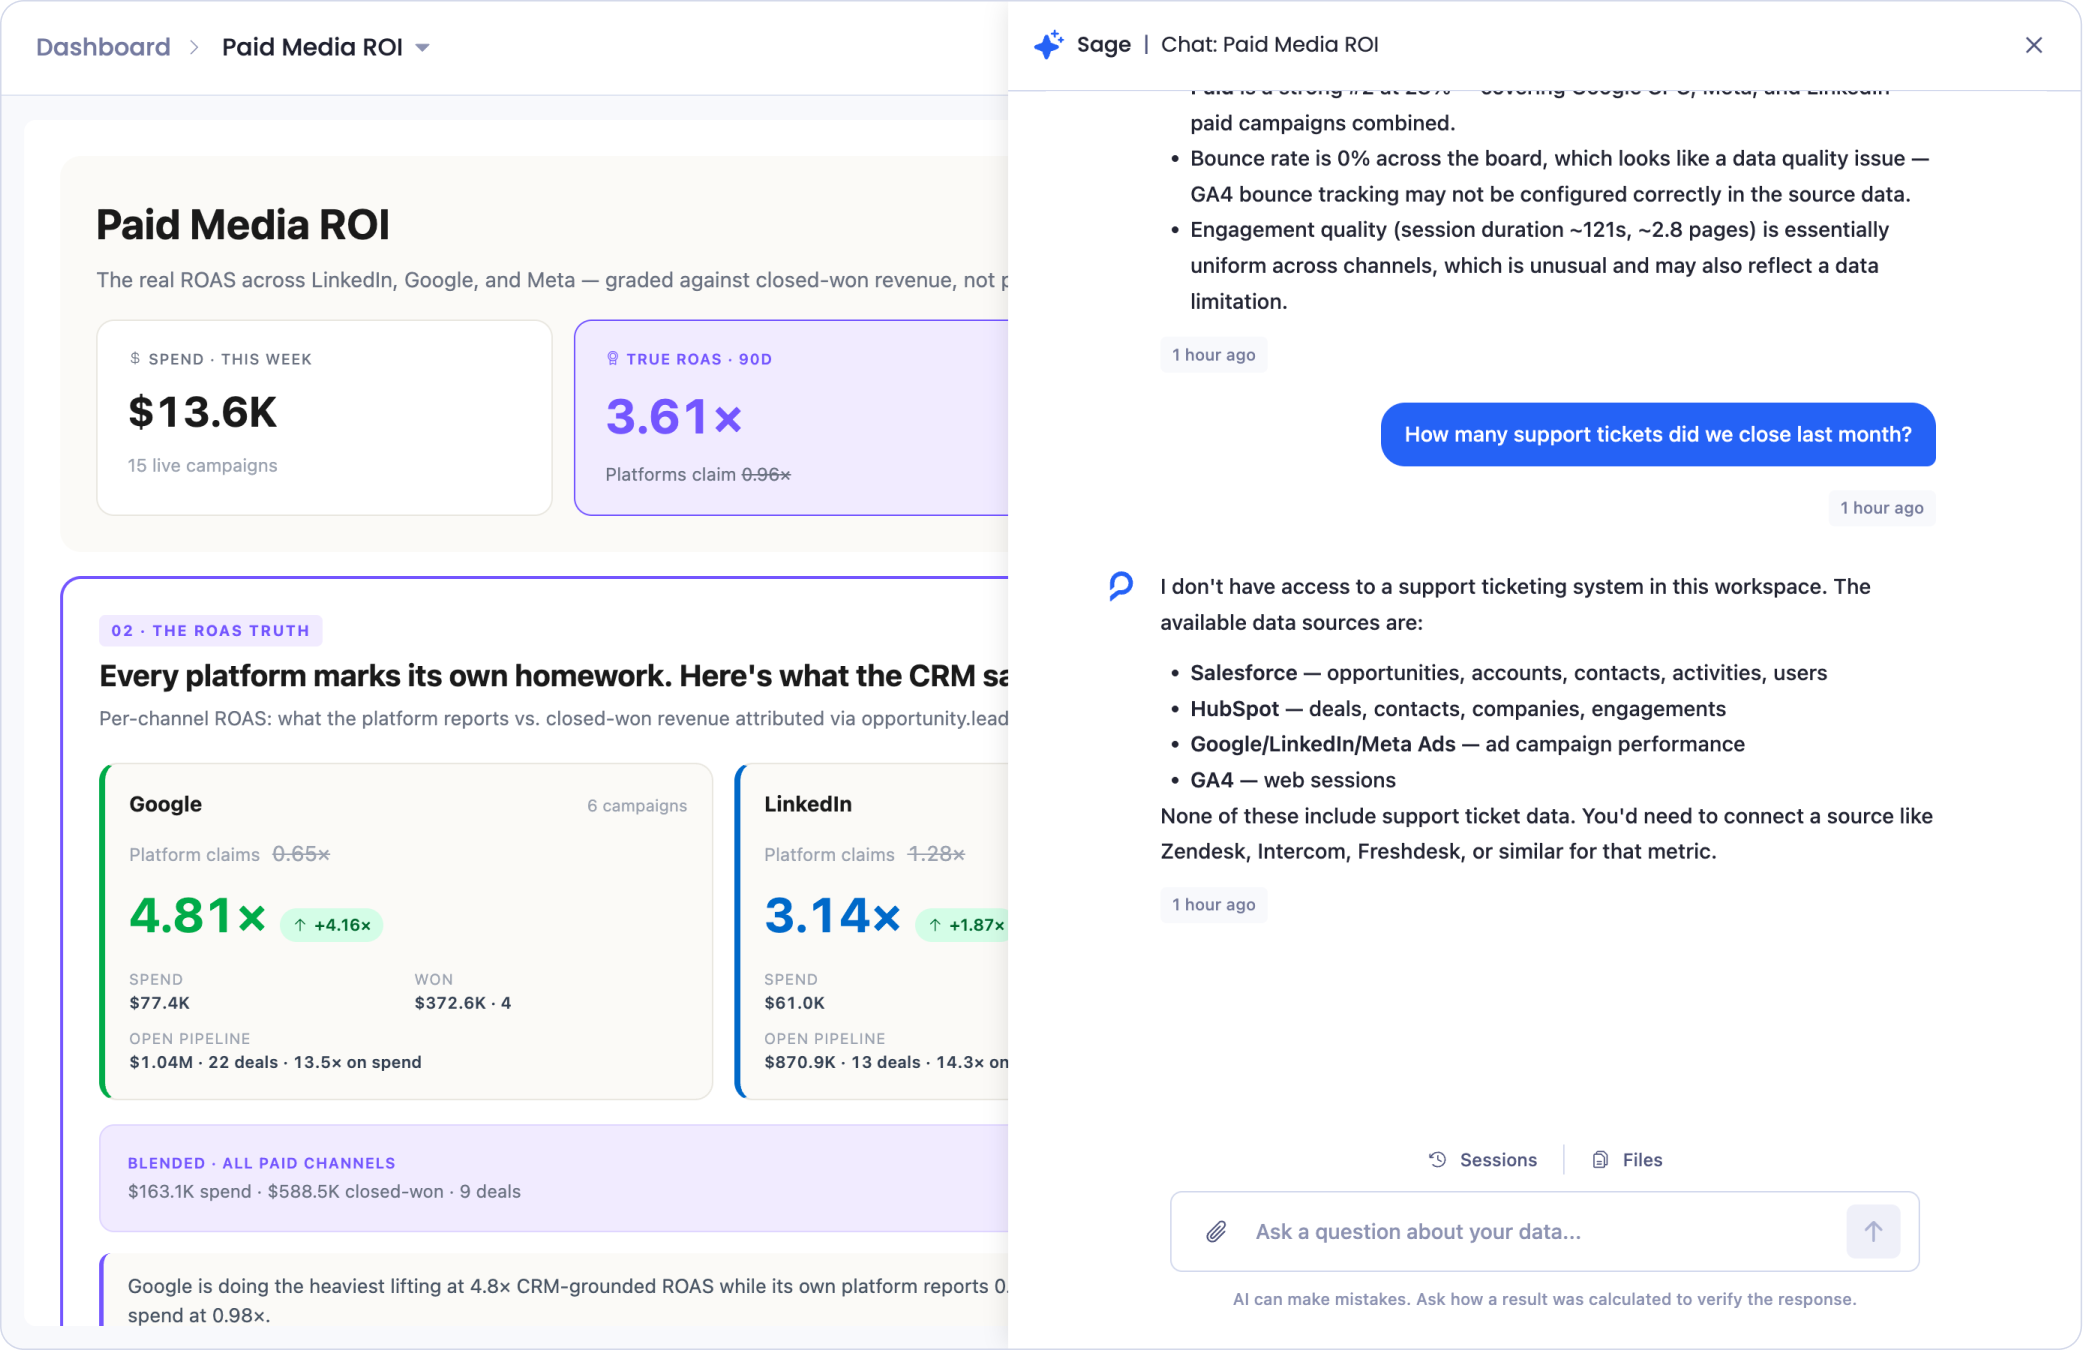
What it can't reach is data you haven't connected. Ask about something with no source behind it and Sage tells you plainly, names the sources it does have, and suggests what you'd need to connect to answer. You get an honest "I can't see that yet" rather than a made-up number.
Building From Here
You can also ask Sage to build on a dashboard, and it will, opening the result in the same panel. It's useful for a quick look, but there's a limit worth knowing: what you build here can be downloaded, but it can't be verified or published from this panel.
So use dashboard Sage for asking, drilling, and tracing. When you want to build something to keep, something you'll publish, schedule, and refresh, open the main workspace, where the full Verify and Publish flow lives.
Ask How It Changed Over Time
A published dashboard also builds a memory. Each scheduled run is saved, so Sage can answer questions about how your numbers have moved: "how has True ROAS changed over the last month?" or "what moved most since the last board update?"
Sage draws on those saved runs to answer, comparing the dashboard as it is now against how it looked before. See History Folder for how this works and what's kept.
Keep in Mind
It's the same Sage. The engine, the access, and the way it works are the same as the main workspace. Opening it from a dashboard just gives it that dashboard as its starting context.
Reach is set by your sources. Sage can go beyond the dashboard to anything in your connected data, and it tells you honestly when something isn't connected.
Build to keep in the main workspace. You can build in the dashboard panel, but it can only be downloaded from here, not published. For anything you want to verify, publish, or schedule, use the main workspace.
Getting Help
If you have questions, run into issues, or want to share feedback on the experience, reach out to us directly at support@petavue.com. We're available and responsive, and your input matters.