Creating Data Summaries
A dashboard shows you everything at once and leaves you to find the story in it. A Data Summary tells you the story directly: what moved this period, the numbers behind it, and what each one means for the call you're about to make. You decide what it should cover and who it's for, see it before it goes out, and choose where it lands.
Most people publish a Data Summary alongside a dashboard, so the two travel together. But it stands on its own just as well. If what your team needs is the written readout, not the widgets, you can publish the Data Summary by itself.
What Is a Data Summary?
A Data Summary is one of the outputs a workflow can produce: a written readout of the analysis Petavue just ran, in plain language rather than charts. Where a dashboard lays the numbers out, a Data Summary talks you through them, naming what changed and why it matters.
You set it up when you publish, and from then on it's rewritten from the latest numbers every time your data refreshes. The readout you get on Monday reflects Monday's data, not the day you first built it.
That's what keeps it honest. A Data Summary is never a snapshot someone pulled together once and forgot about. It reflects whatever the analysis reflects, every time it runs.
What's in a Data Summary
A Data Summary is written to be skimmed first and read second. Depending on your prompt and your data, it typically includes:
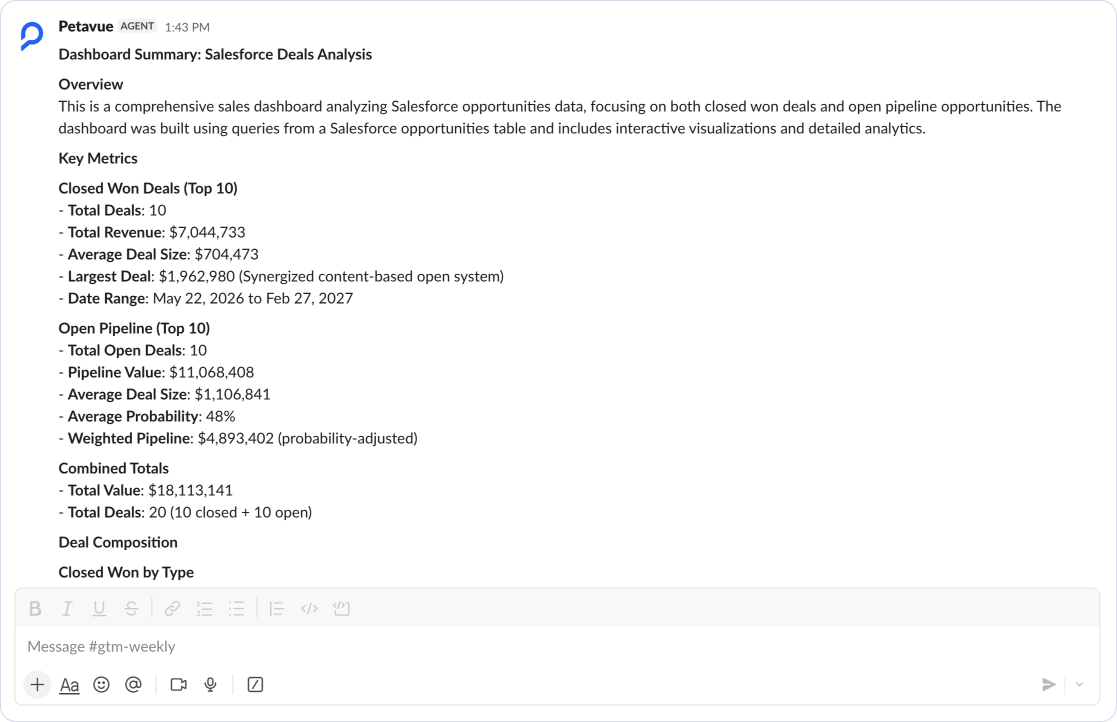
- A title and the period it covers, with the date it was published
- A TL;DR, the short narrative of what happened and what stands out
- Numbered sections that each focus on one part of the story, such as an overall snapshot or a weekly trend
- Metrics tables giving the numbers behind each section
- A Signal line that says what a number actually means, not just what it is
- A prioritized table of what to look at, ordered P1 through P3
- A footer naming the data source, the analysis period, and when it was generated
Creating a Data Summary
A Data Summary is set up when you publish, in the same flow that verifies your dashboard and sets its refresh schedule. The path runs from building your analysis in a session, through Verify, and into Publish, where Workflow, Outputs, and Schedule are the three steps at the bottom of the dialog.
You don't need to publish a dashboard to get a Data Summary. At the Outputs step you decide what this analysis produces, and a Data Summary on its own is a valid choice. If the written readout is all your team needs, publish that and leave the dashboard off.
Step 1: Build your analysis
From the home page, start a session and ask for the analysis you want. Work with it in chat until the result is what you need. This is the same starting point as any dashboard. See Building a Dashboard for more on building and refining an analysis.
Step 2: Verify the result
When the analysis is ready, open the publish dialog and work through the Verify tab. Verification is what makes everything downstream dependable: your summary is written from numbers that have already been checked and traced back to source.
Step 3: Choose your outputs
On the Publish tab, you'll see the question "What do you want to publish?" with a toggle for each output you can turn on. Set each one up right where you turn it on.
If you want a dashboard from this analysis, switch on Dashboard and give it a name. To get a written readout, switch on Summary. Turn on both, or just the one you need.
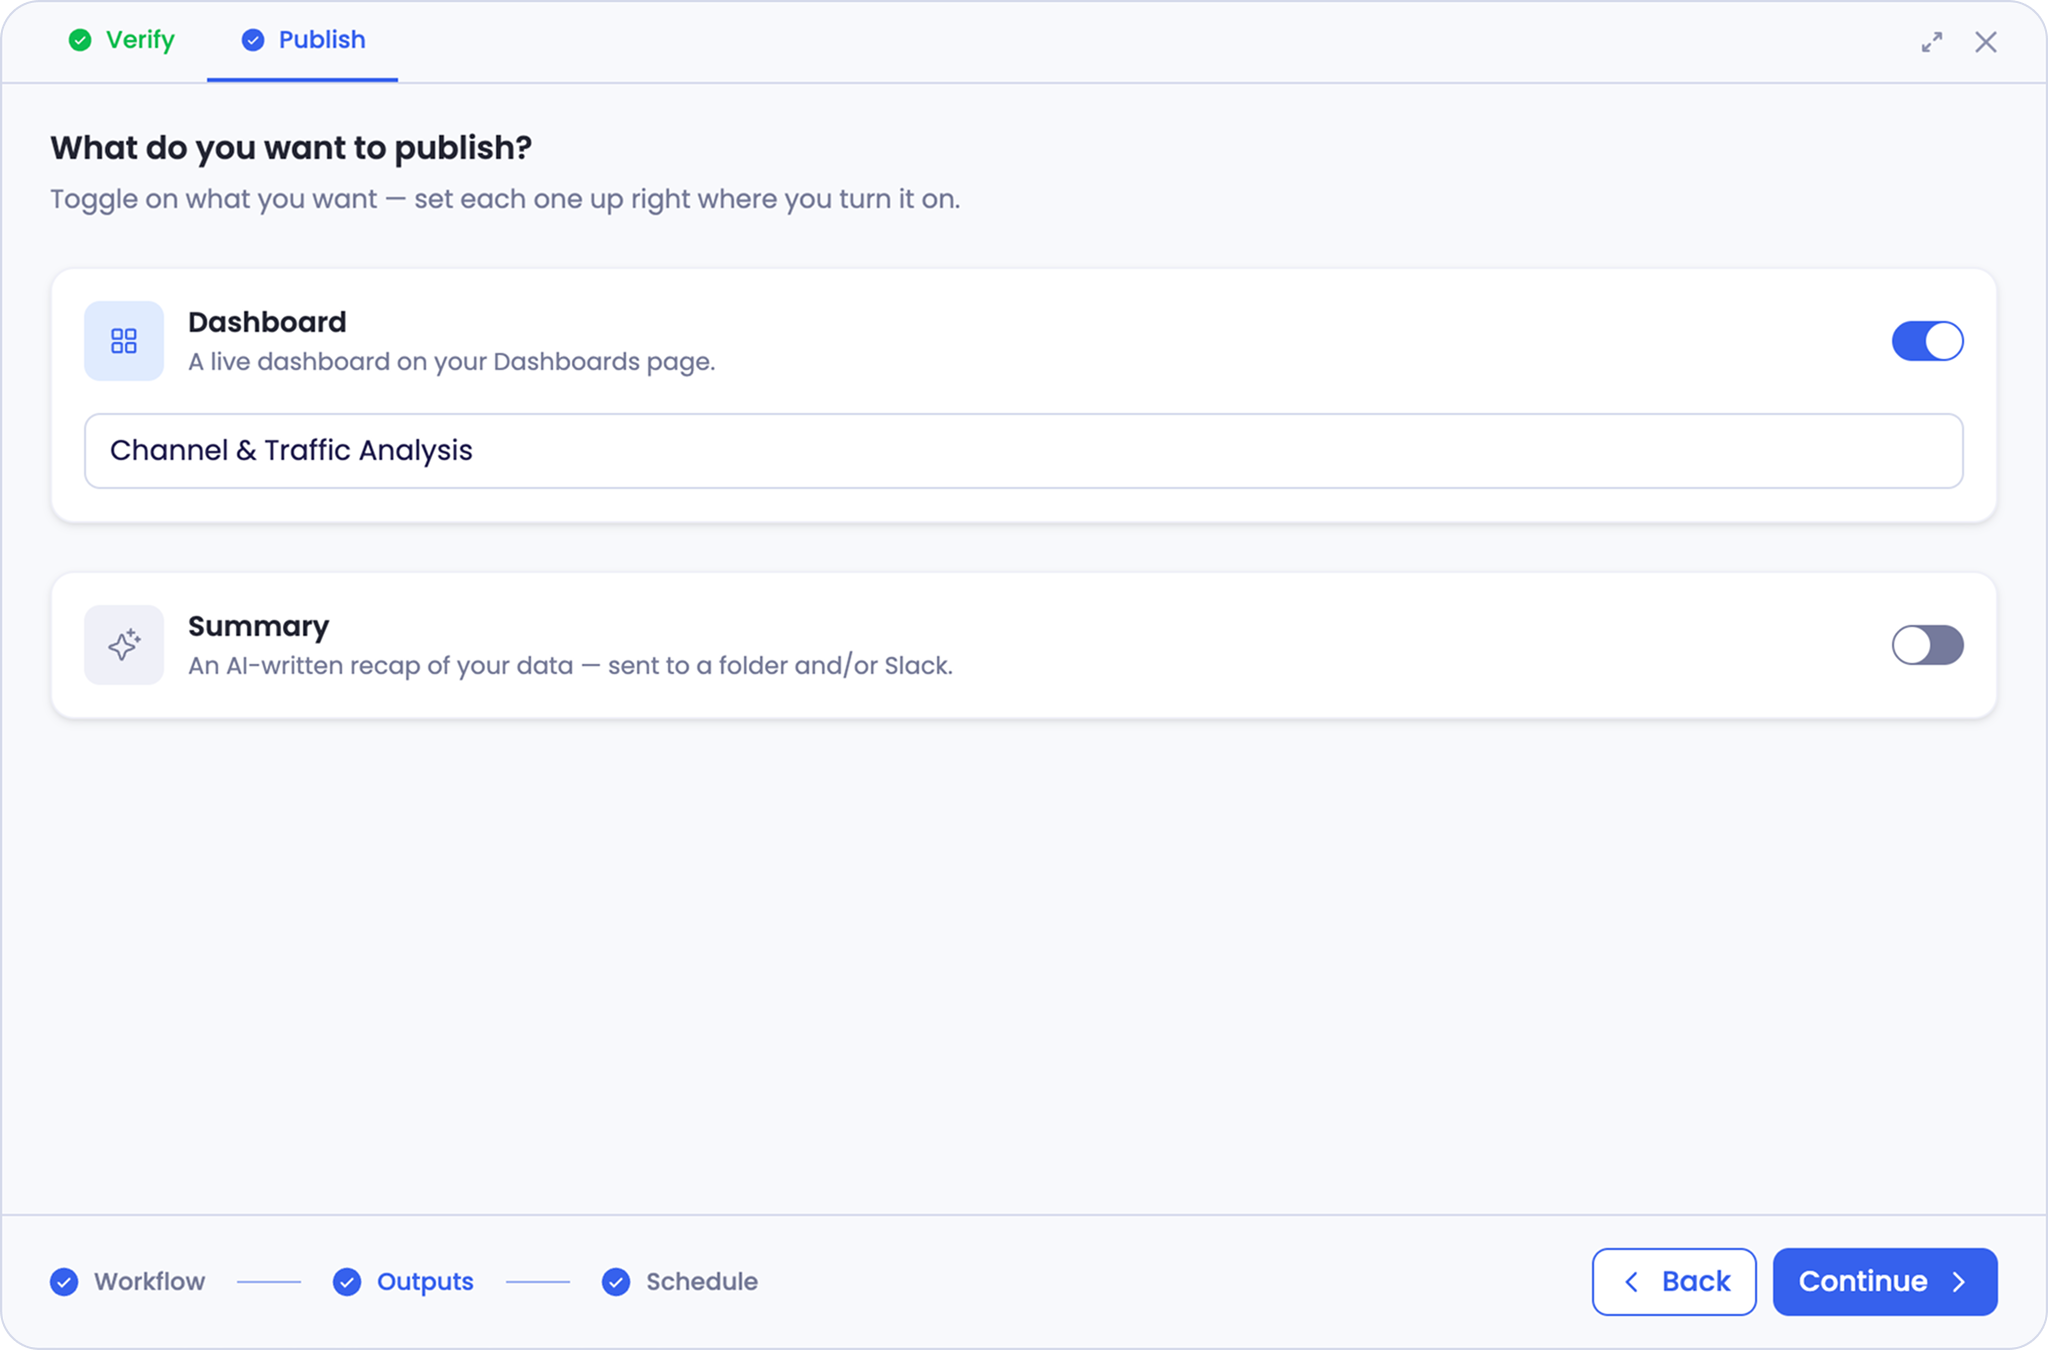
Step 4: Write your summary prompt
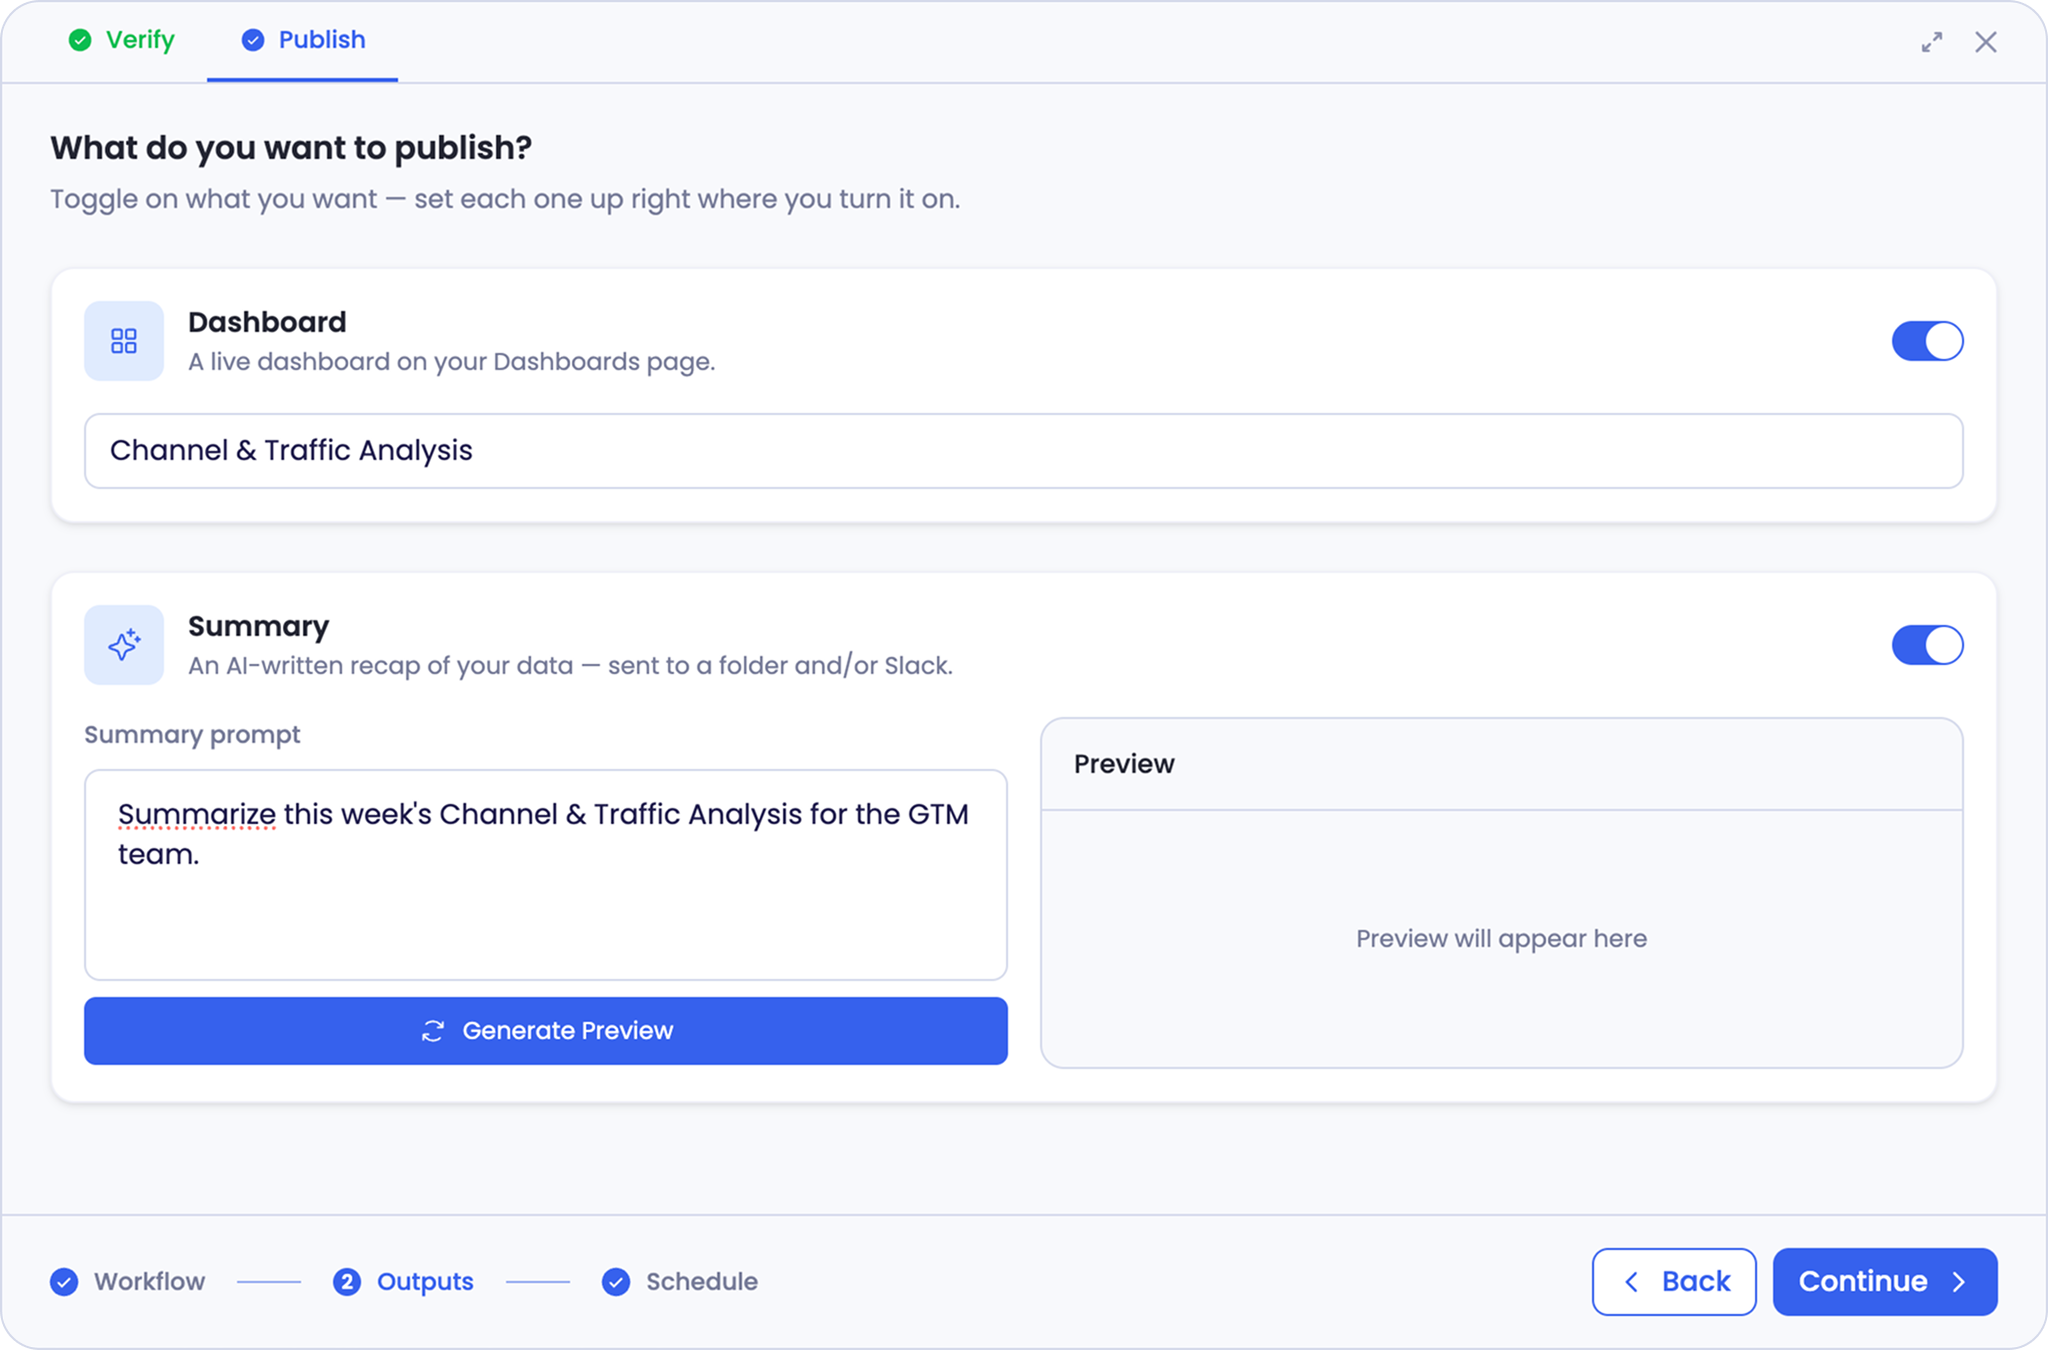
Turning on Summary reveals a Summary prompt field. This is where you say what the readout should cover and who it's for.
Make it specific. It doesn't have to be short, and how much you write depends on what you want back. You can point it at the whole dashboard, or at a single metric or a related group of metrics you care about most. You can ask for the numbers as they stand, or broken down as a trend over time, or split across segments like channel, region, or campaign. The more precisely you name the cut you want, the closer the first draft lands.
This is a matter of prompt styling. The same data reads differently depending on who you write the prompt for, so naming the audience shapes the tone and the level of detail. A readout for the GTM team isn't written the same way as one for a founder or a paid media manager, and saying who it's for up front saves you a round of edits.
Step 5: Preview and refine
Select Generate Preview to see a sample of the summary before you commit to it. It takes a minute or two to build, then appears beside your prompt, giving you a feel for the story it will tell and the shape it will take.
Read it and decide whether it's heading in the right direction. If not, adjust the prompt and select Regenerate to try again. Repeat until it reads the way you want.
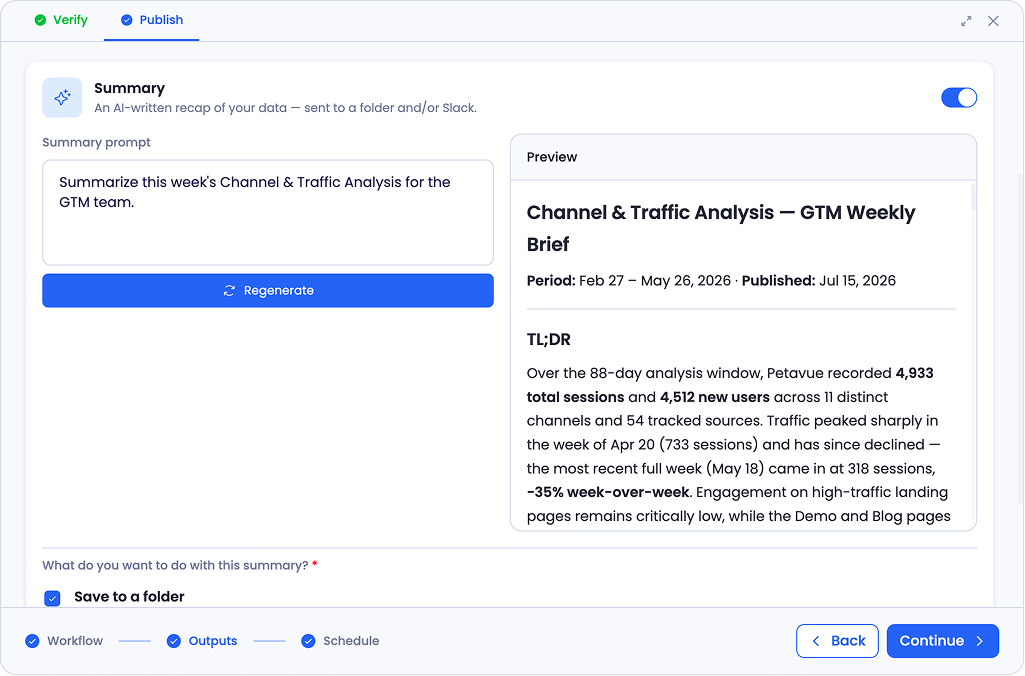
Step 6: Choose where it goes
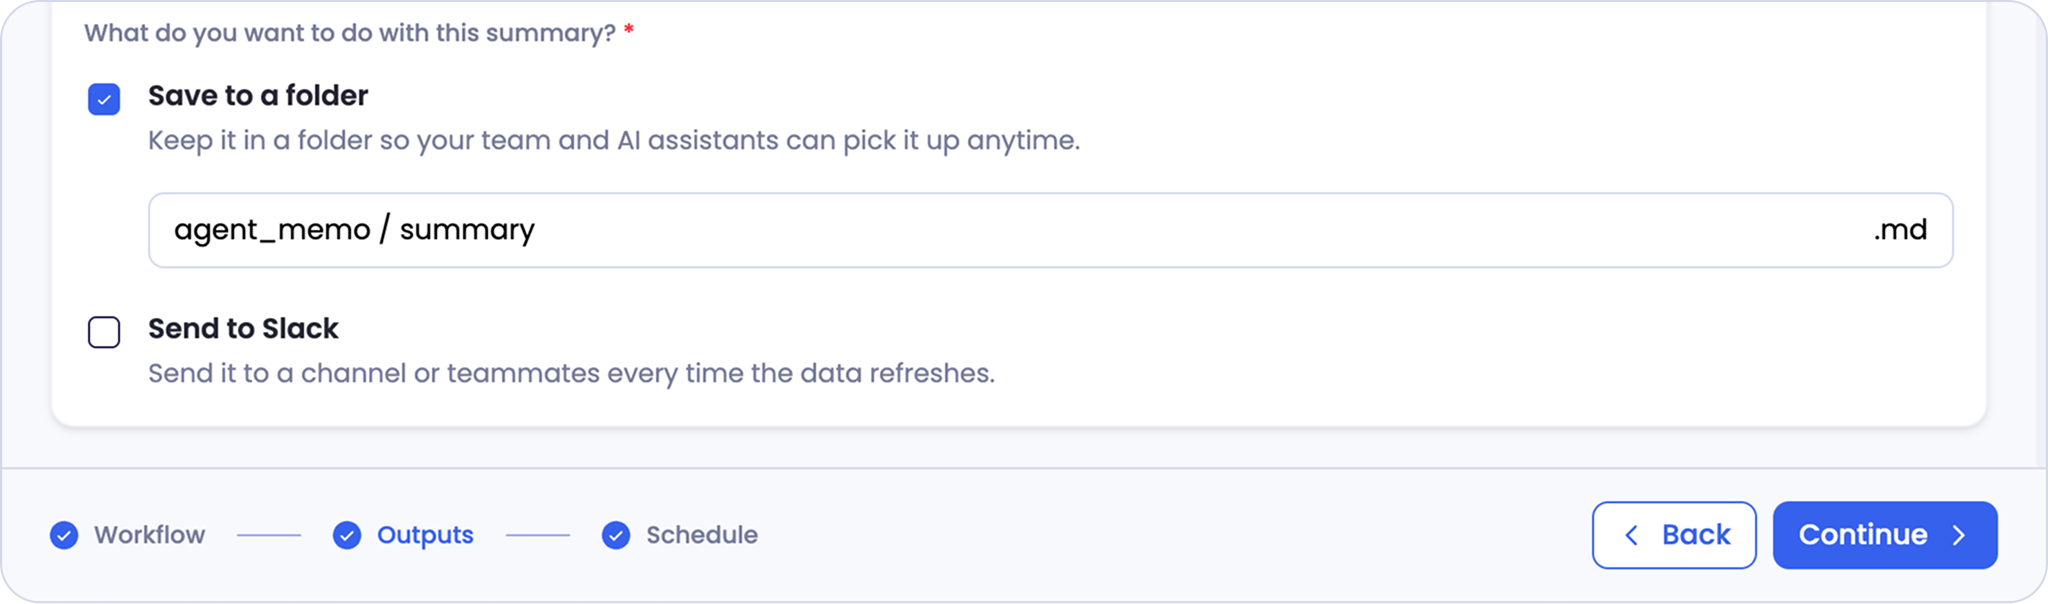
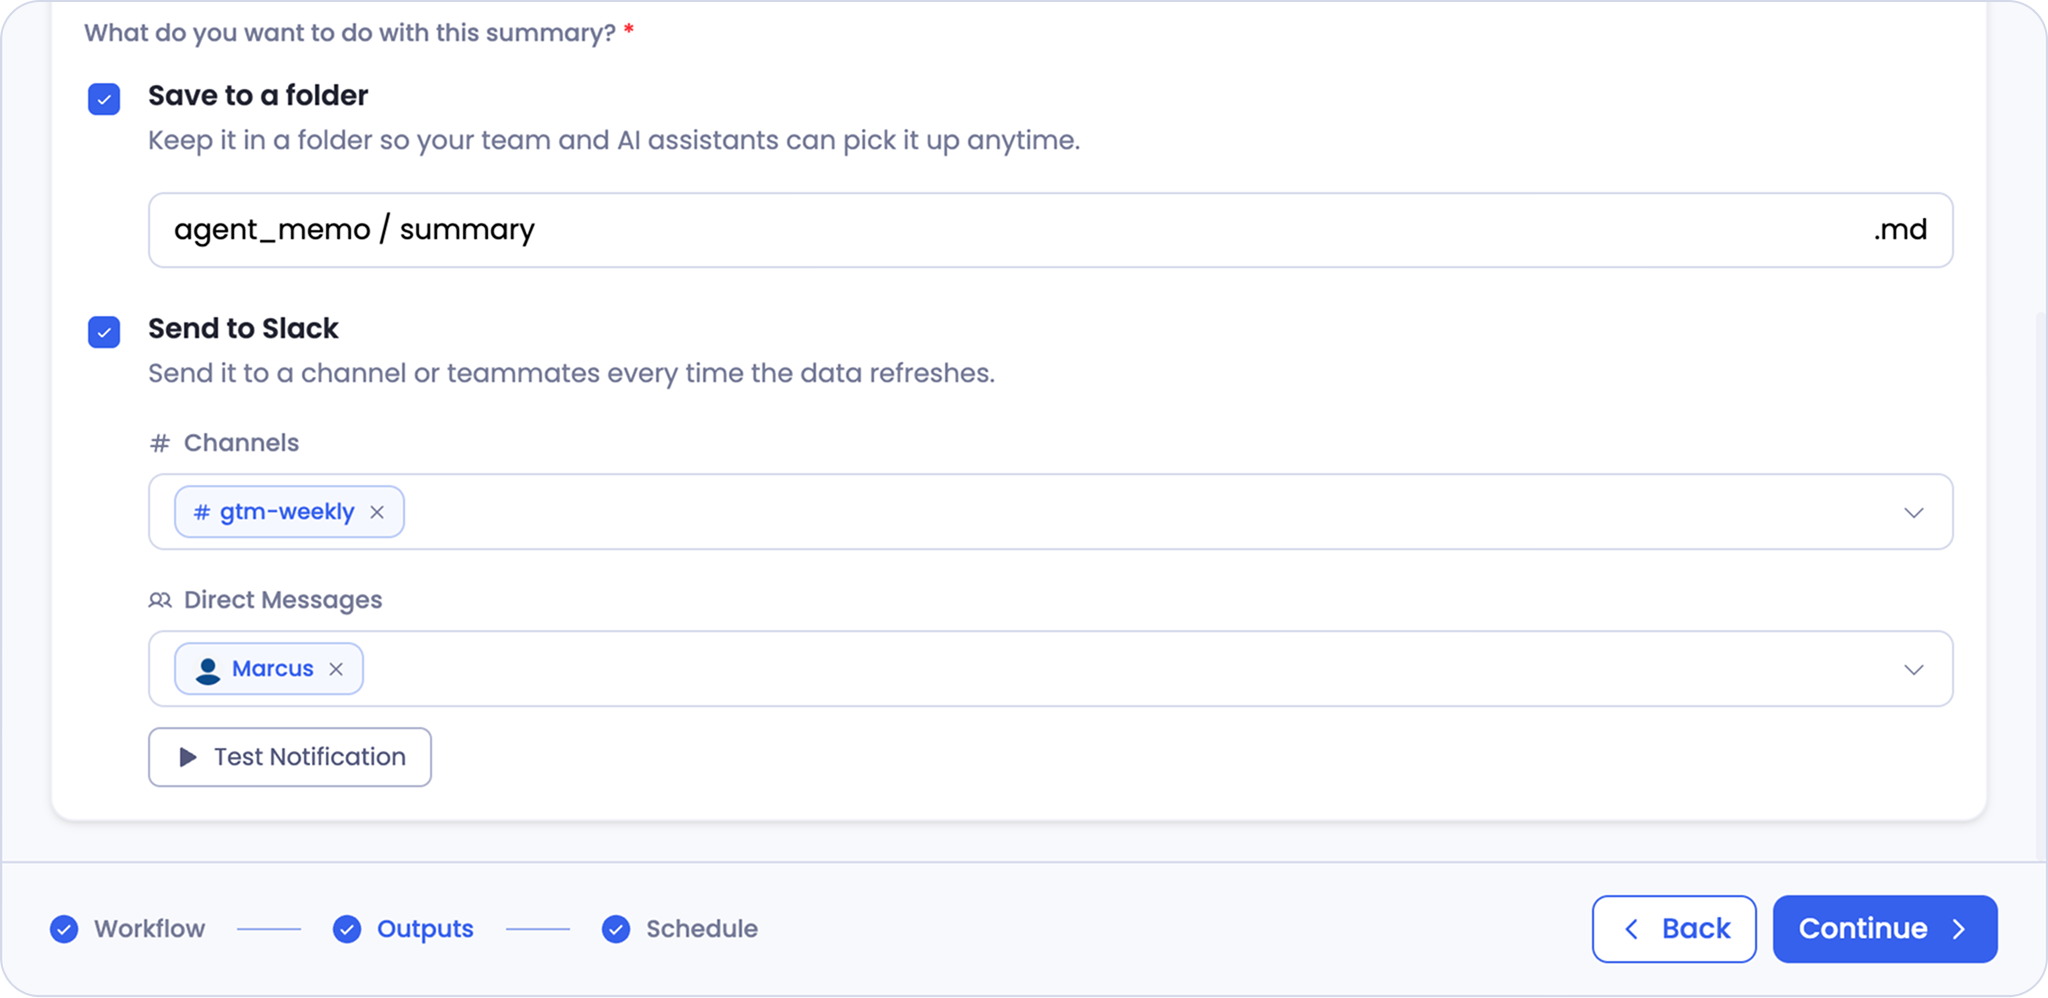
Under What do you want to do with this summary?, pick how you want to receive it. You can choose either option or both.
- Save to a folder keeps the summary in a folder your team and AI assistants can pick up anytime. Name the folder, and Petavue saves the summary there as a
.mdfile. - Send to Slack posts it to a channel or to teammates every time the data refreshes. Choose any number of Channels, Direct Messages, or both.
Step 7: Send a test
If you're sending to Slack, select Test Notification to post the summary to your chosen channels right away. You'll see a "Test notification sent!" confirmation, and the message appears in Slack titled Test Notification so nobody mistakes it for the real thing.
This is worth doing. It's the fastest way to see how the brief actually reads in the channel before you commit to a schedule.
How It Arrives in Slack
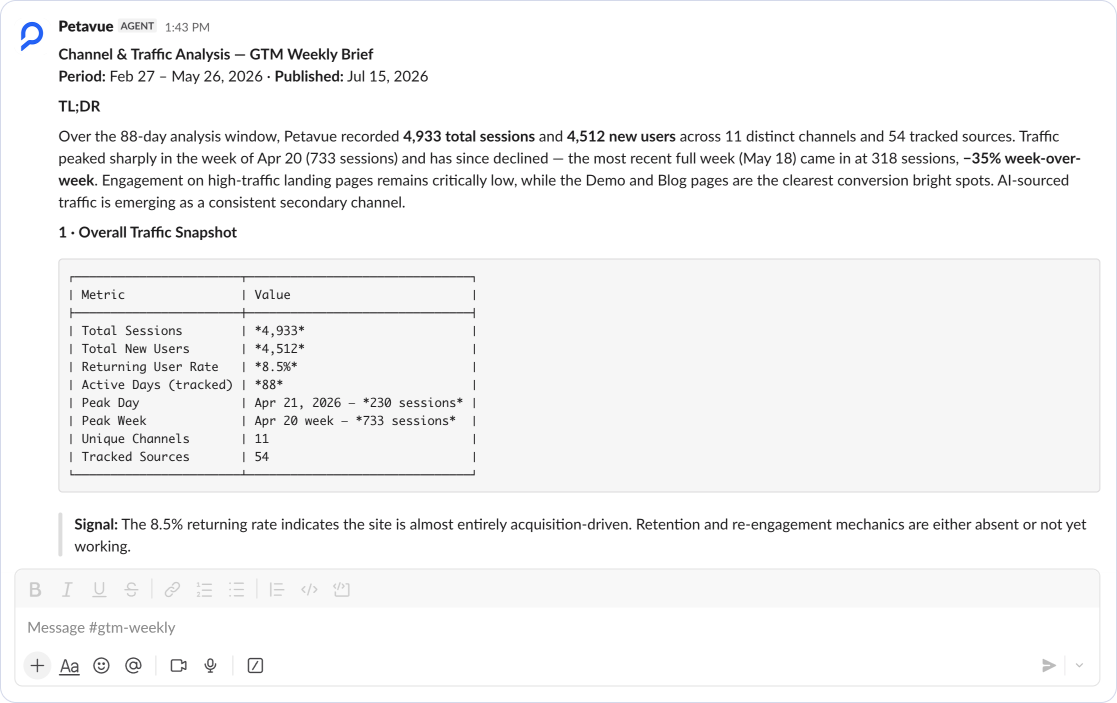
Once published, the summary posts to your chosen channels and teammates as a Petavue message, carrying an AGENT badge so everyone can see it came from Petavue rather than a colleague.
The full brief is delivered inline, formatted for reading in the channel: the title and period, the TL;DR, then each numbered section with its metrics table and Signal line. Your team gets the whole story where they already work, without opening Petavue or clicking through to a dashboard.
Why You Can Trust It
Every figure in a summary traces back to the dashboard and its source data. Publishing checks your dashboard two ways, with a human check and an agent check, then saves it as a recipe: a fixed definition built to run cleanly on new data every time. Your summary is a recipe that rides on top of that.
Data Summaries use verified numbers only and speak in plain language, with no SQL or query internals. Each one names its data source and the period it covers, so you can always see where it came from. The figures are fixed by your verified analysis; the narrative around them is Petavue's reading, which is what the preview lets you check and the prompt lets you steer. See Understanding Workflows for more on how this foundation works.
Choosing Where Your Data Summary Goes
You've seen how to set both destinations. Which to use comes down to whether the summary should wait to be found or arrive on its own.
A folder is the quiet choice. The summary sits there for anyone who goes looking, and each refresh adds to a written trail you can trace back through. It fits a record you want on hand but not announced.
Slack is the loud choice. The brief lands in front of people in the flow of work, which fits a readout the team is meant to act on, like a weekly number the whole GTM channel talks through together.
Pick the folder when the summary is reference, Slack when it's a prompt to do something. Many teams use both.
A summary is something Petavue pushes to you on a schedule. If you want to pull an answer instead, asking a question whenever one comes up, you can talk to Petavue directly in Slack. See Sage in Slack.
Getting Help
If you have questions, run into issues, or want to share feedback on the experience, reach out to us directly at support@petavue.com. We're available and responsive, and your input matters.