Pipeline Coverage
Every week, sales leadership asks the same question — are we on track? — and every week the answer means assembling a coverage ratio out of CRM data, last week's quota, and someone's spreadsheet of slipped deals. The pieces are real; the friction is in the assembly. By Tuesday afternoon you have a number, and by Friday it's stale.
What this skill answers
Pipeline Coverage tracks your qualifying open pipeline against remaining quota, as a ratio, across the org, segments, teams, and reps. You set the definitions once and it refreshes on a cadence, so the number doesn't drift between when sales leadership reads it Monday and when finance reviews it Wednesday.
It is traceable, not predictive. It applies your stage rules, your weighting, and your remaining-quota method faithfully to your data. It measures whether you have enough pipeline relative to target. It does not forecast whether you'll hit it — whether your rules are the right ones is your forecast discipline.
What you'll see
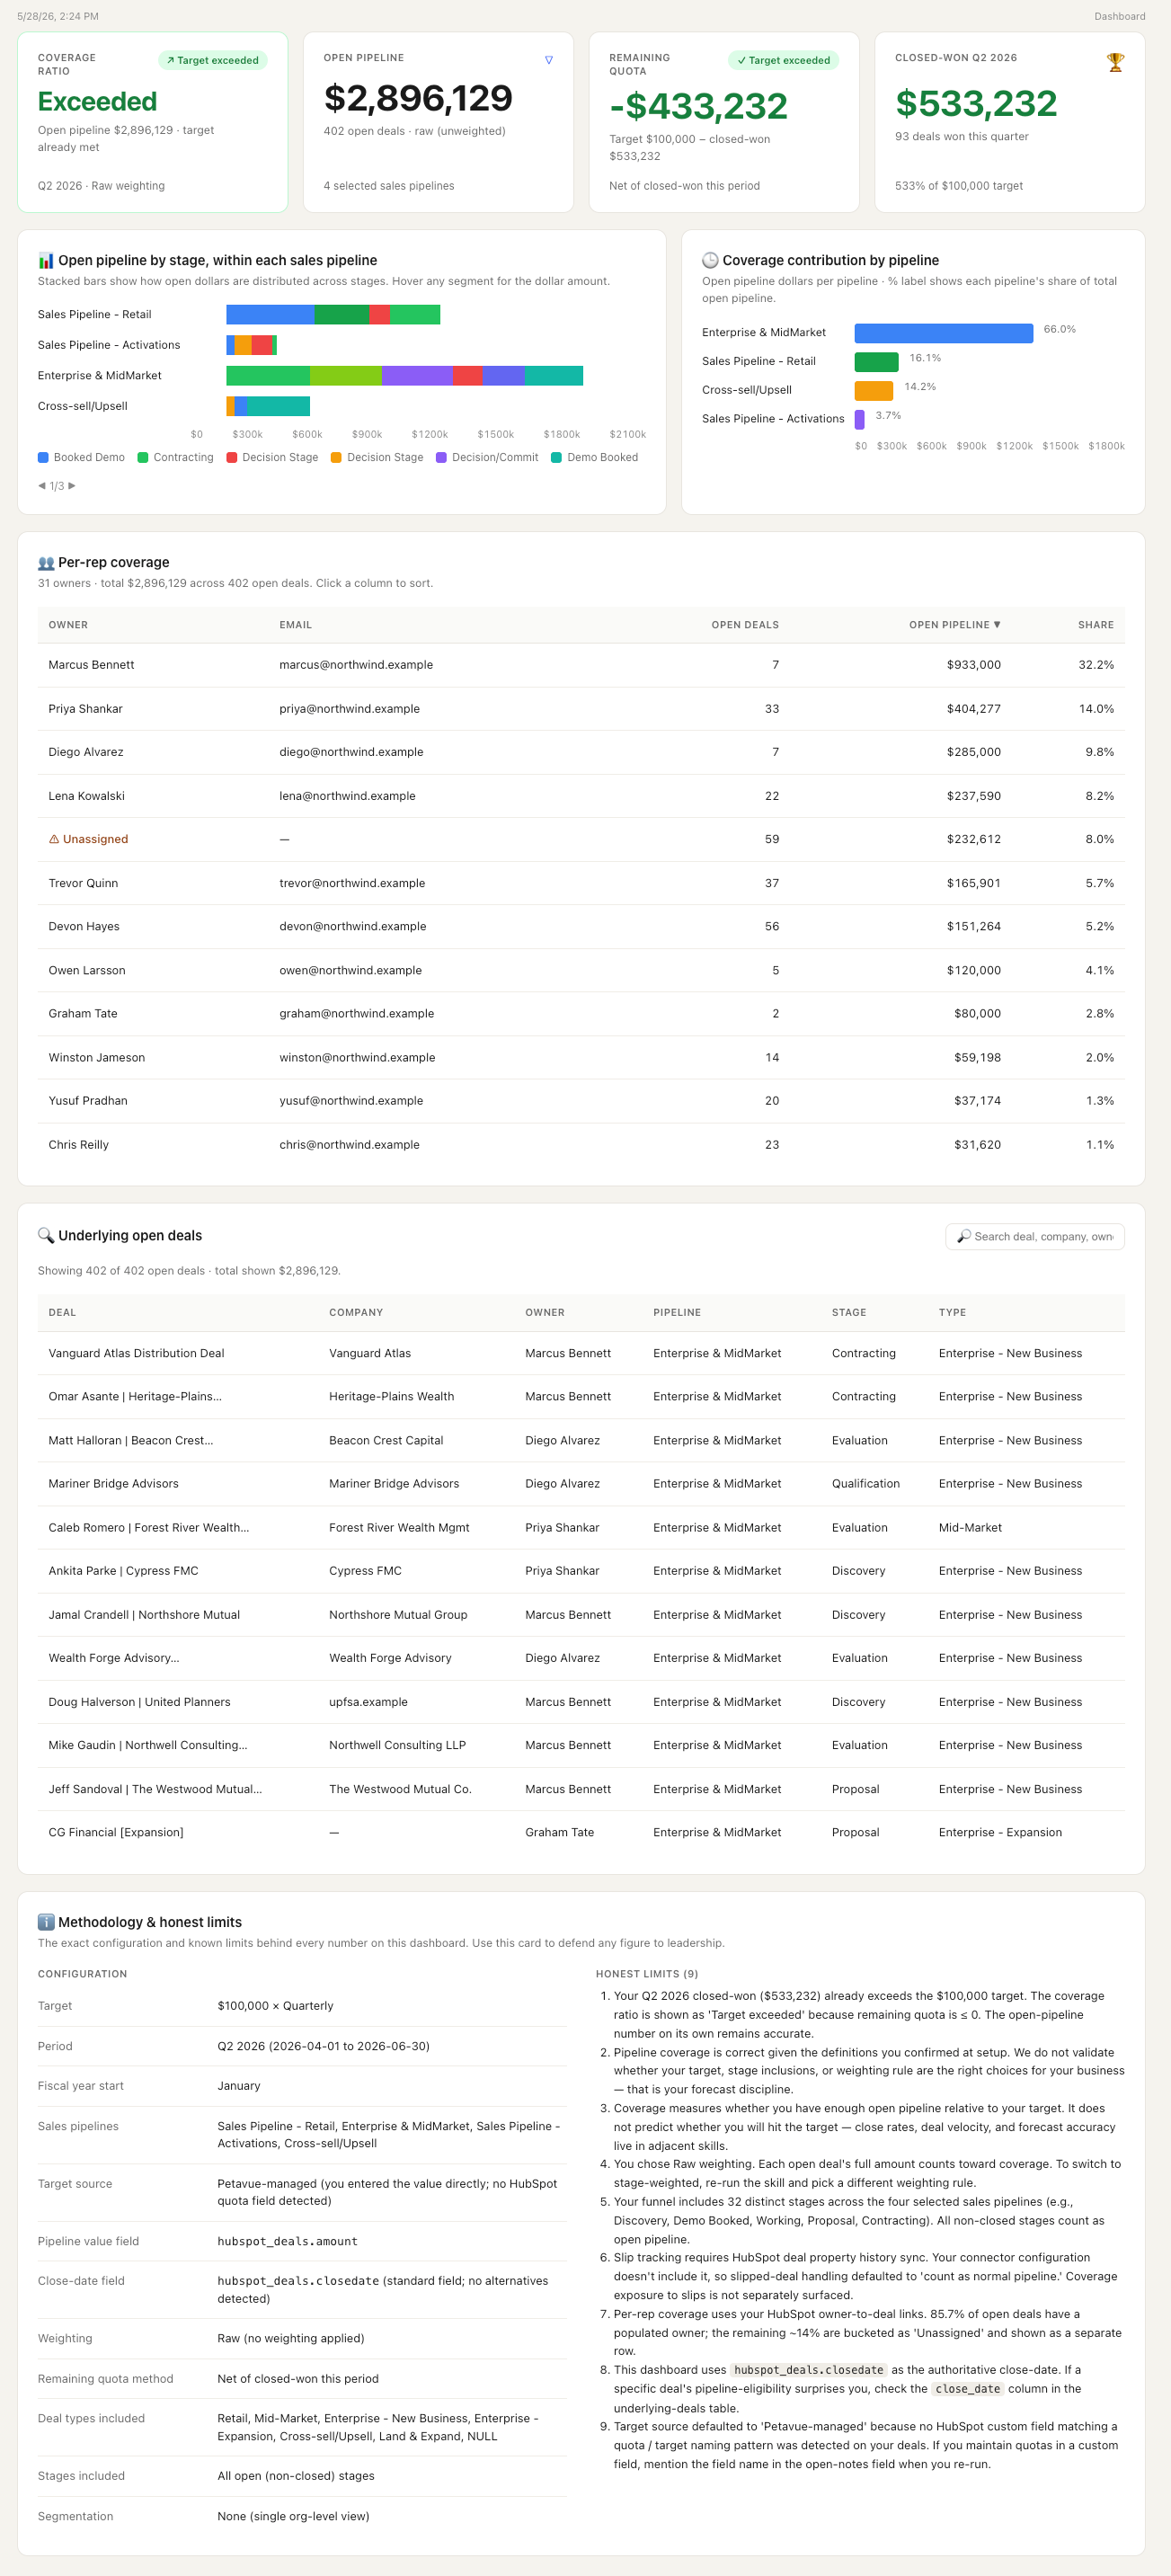
A dashboard built in about 21 minutes: four KPI tiles and four core widgets, with more views that appear when your data supports them.
- Coverage ratio — your qualifying open pipeline against remaining quota, as a ratio and against your target coverage. The headline number for the quarter.
- Coverage by team — the same ratio by segment and team, so you can see where coverage is strong and where it's short.
- Coverage trend — coverage week over week, with each past week locked to the definitions used when it ran. The trend doesn't rewrite itself when you change the setup.
- Underlying deals — the audit table. One row per open deal: value, stage, the weighting applied, owner, and close date. Every dollar of pipeline ties back to a real deal in two clicks.
Conditional views appear when the data calls for them: a per-rep breakdown when there are enough reps to show without singling anyone out, a slipped-deal view when your CRM history shows deals moving their close dates, and a segment breakdown when a segment field is available.
Before you run it
Required:
- A CRM (Salesforce or HubSpot) with open opportunities, stage, and amount fields
Optional, but they unlock more:
- A target source — a CRM field, an uploaded operating-plan sheet, or a number you enter
- Owner and segment fields, which power the by-team, per-rep, and segment breakdowns
- CRM close-date history, which powers the slipped-deal view
If a required source isn't connected, the agent stops before running and names it. See CRM Integrations for setup.
What the agent asks you
This is the most setup-heavy skill in the library, because forecasting assumptions are consequential. The agent prefills what it can detect; you confirm or edit each answer and review the full plan before anything builds. More appear only if your data calls for them.
| Question | Why it matters | Default |
|---|---|---|
| What's your target, and over what period? | Revenue, deal count, or units, measured quarterly, half, or annually | Prefilled from your data |
| Where does your target come from? | A CRM field, an uploaded operating-plan sheet, or a number you enter | Detected, or entered |
| When does your fiscal quarter start? | Sets the period boundaries | Prefilled from your close-date pattern |
| How should we calculate remaining quota? | Gross, net of closed-won so far, net of credited closed-won, or a locked baseline | Prefilled; you confirm |
| Which close-date field should we use? | Determines the cohort | Standard close date |
| Which field holds the deal's value? | What gets summed into pipeline | Standard amount |
| How should we weight open pipeline? | Raw, stage-weighted, forecast-category-weighted, or CRM probability | Prefilled; you confirm |
Most teams edit the defaults once during setup, save the template, and let it replay weekly. Nothing runs until you confirm.
How to read the result
The headline is a ratio. 3.0x means you have $3 of open pipeline for every $1 of remaining quota. What counts as healthy depends on your win rate; most B2B SaaS teams target 3.0–4.0x.
The by-team breakdown is where the diagnostic value lives. An overall 3.5x can mask a 1.2x in Enterprise and a 5.8x in Mid-Market. The breakdown surfaces that gap; click any segment for the deals behind it. The per-rep view shows coverage by owner, where reps below their target are the early signal for the quarter's exposure. The trend shows movement week over week, with each past week frozen to the definitions it ran under, so the history stays honest when you change the setup.
Known limits you'll see:
"Coverage is correct given the definitions you confirmed at setup. We do not validate whether your target, stage inclusions, or weighting rule are the right choices for your business — that is your forecast discipline." Always active.
"[N] opportunities worth [$Y] have slipped under your definition. Per your handling rule, they contribute [description] to the coverage total." Surfaces when slip is detected in your CRM history.
"Slip tracking requires close-date history. Your connector configuration doesn't include it, so slipped deals are counted as normal pipeline." Surfaces when that history isn't available.
What this skill doesn't do
- Why coverage dropped versus last week? The Coverage trend widget shows the movement; comparing the two weeks' setups shows what changed.
- Surface stalled deals or time-in-stage? Not in this release.
- Assign revenue credit to channels? → Multi-touch Revenue Attribution