Golden Path Analysis
Every revenue leader has a hunch about which sequence wins. Get an exec sponsor in the first 30 days and the deal closes. Pricing before the security review goes badly. Reps who run the same sequence in order win twice as often. Nobody can prove these, because reconstructing per-deal sequences from stages, activities, and touches is a multi-week analyst project — done once a year for the QBR, by which point the motion has already changed.
What this skill answers
The agent mines your closed deals, wins and losses both, for ordered sequences of stages and touches. It computes the win rate of each sequence, surfaces the ones where the win rate sits meaningfully above your baseline, and identifies the step where similar-but-losing deals most often stalled. It re-runs on demand.
This is conditional probability with a significance flag, not causation. Deals that followed a sequence closed more often. That is not proof the sequence caused the wins — there may be a common upstream factor like deal size, segment, or owner. Use the output to design experiments, not as final attribution.
What you'll see
A dashboard built in about 18 minutes:
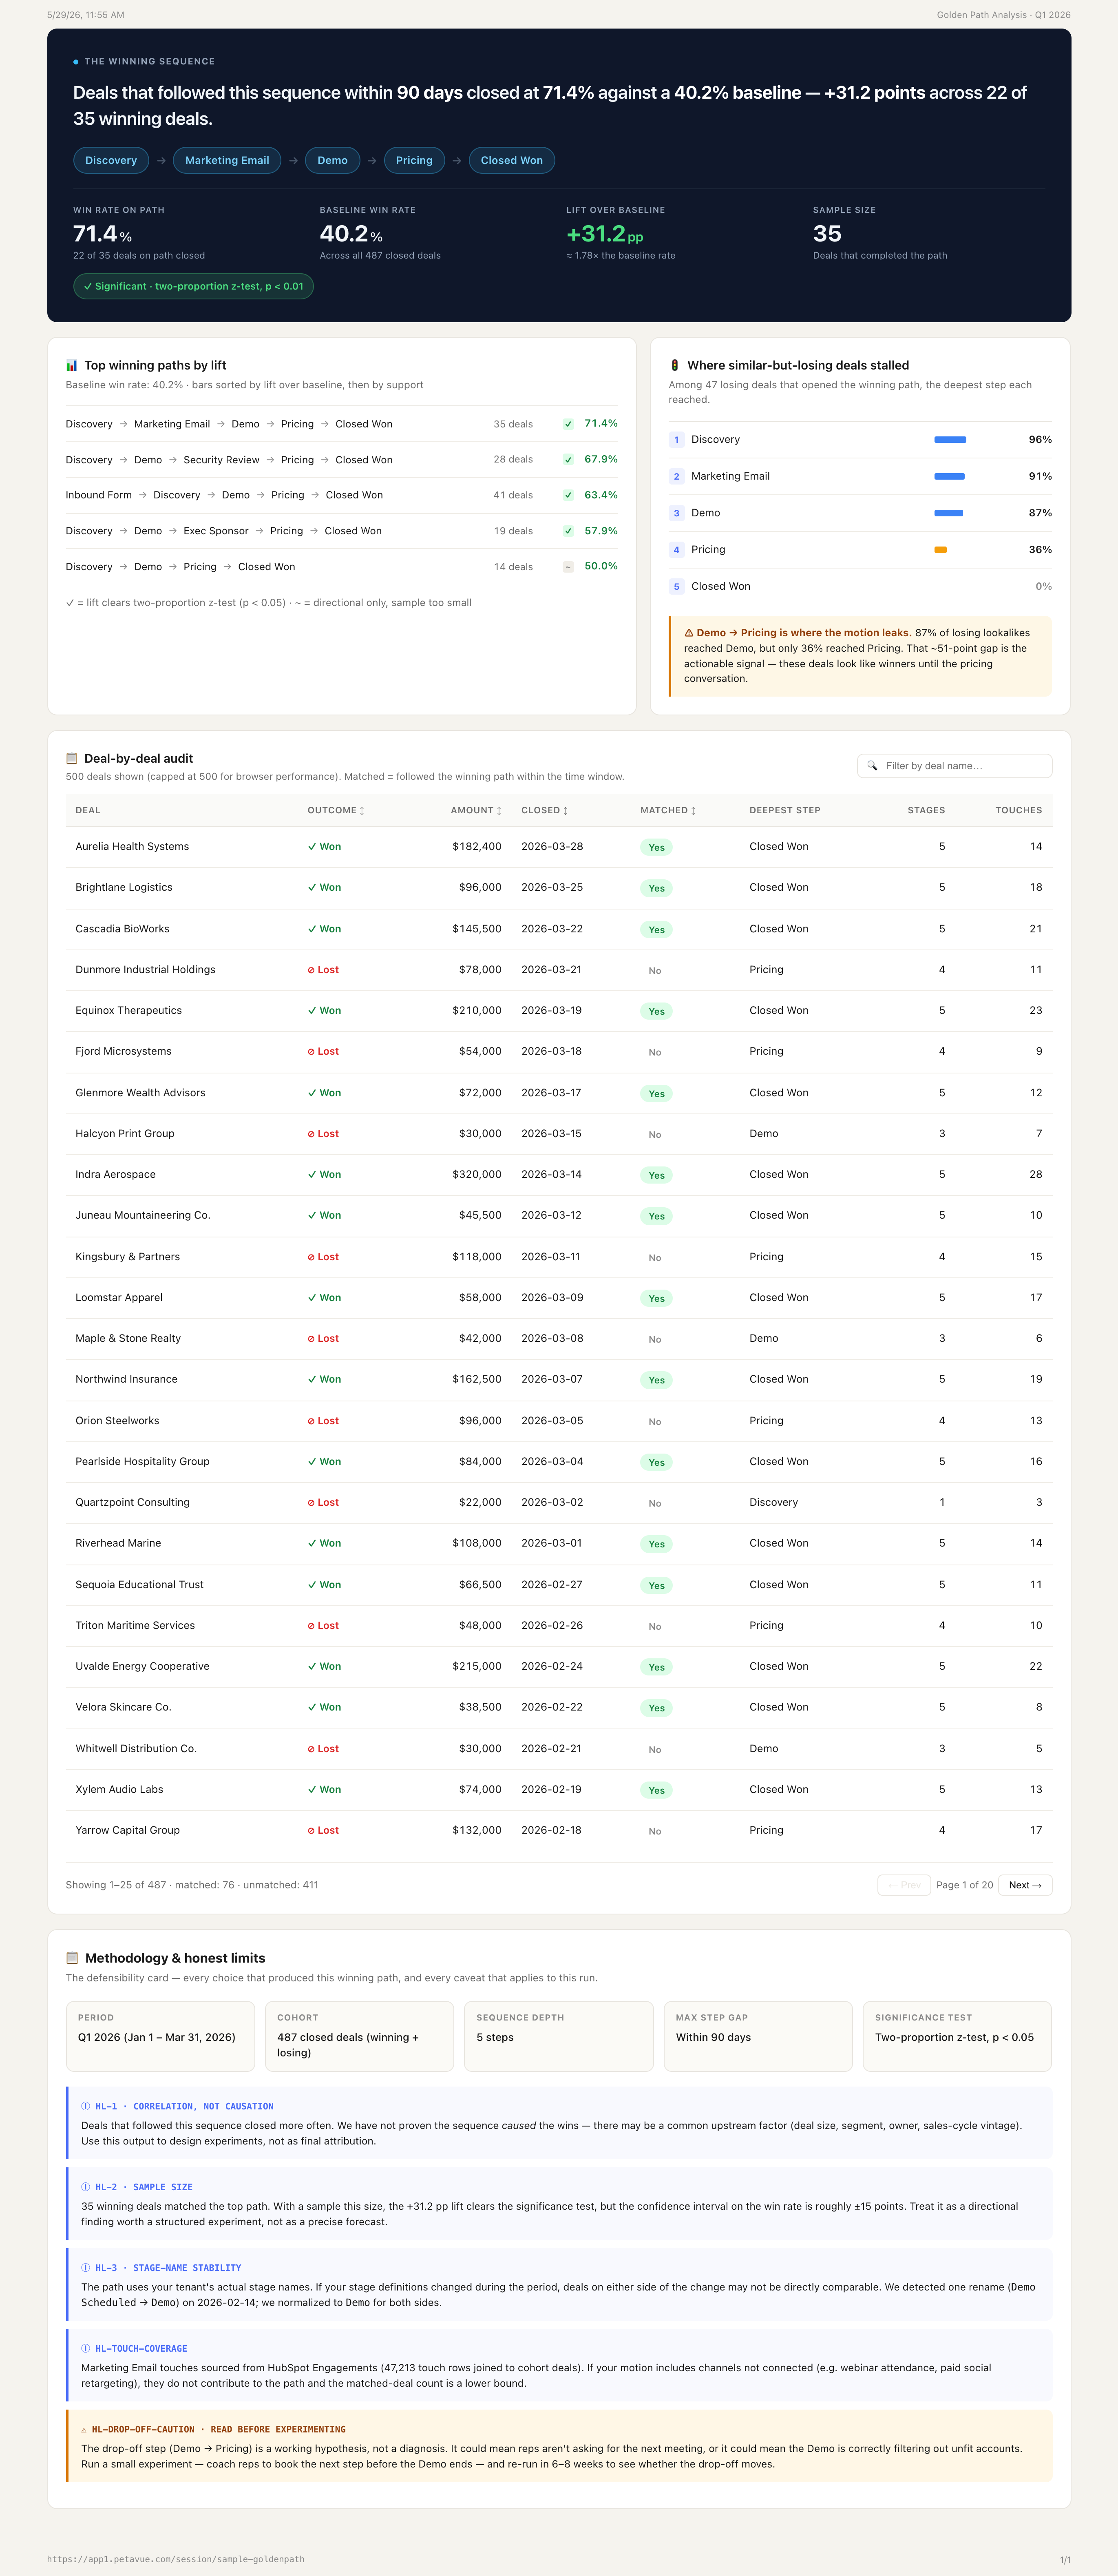
- Winning path — the touch-and-stage sequence your winning deals follow most, with its win rate, your baseline, the lift between them, and where lookalike deals that lost fell off. For example: "Deals that followed Discovery → Email → Demo → Pricing → Close within 90 days closed at 71%, against a 40% baseline — +31 points across 22 of 35 winning deals." Every figure clicks through to the deals behind it.
- Top paths compared — the top five winning sequences ranked by lift over baseline, each flagged when the lift clears a significance test.
- The deals behind it — the audit table. One row per closed deal: its sequence, the outcome, how far it followed the winning path, and its stage and touch counts.
Conditional views appear when your data or setup calls for them: a drop-off breakdown, a sequence-vocabulary view, and a time-between-steps distribution.
Before you run it
Required:
- A CRM (Salesforce or HubSpot) with closed deals — both wins and losses in the period
- Opportunity stage history
- A source of touches flowing into
unified_touch_view
Recommended:
- Marketing automation (HubSpot) and ad platforms (Google, LinkedIn, Meta), which enrich the sequences
This is the most data-hungry skill in the library. It needs both wins and losses in the period; if there are too few of either, it shows an empty-state message rather than a misleading lift. And it leans on stage history — without clean history, the path analysis degrades toward a touches-only view. Many new tenants don't have clean field history on day one, so fix that before relying on the skill for ongoing reporting. See CRM Integrations for setup.
What the agent asks you
Two questions, both prefilled from your data, so you can run as-is or adjust. More appear only if your data calls for them, and advanced settings are there if you want them.
| Question | Why it matters | Default |
|---|---|---|
| Which period should we analyze? | Sets the cohort of closed deals, wins and losses | Prefilled from your sales-cycle length (last quarter to last four) |
| How close together must the steps be? | The maximum gap between adjacent steps in a path | Prefilled from your sales-cycle length (within 30, 90, or 180 days, or no constraint) |
Sequence depth — how many steps a path includes — sits under advanced settings; most people won't touch it. Nothing runs until you confirm.
How to read the result
The hero gives you four things at once: the winning sequence, the win rate on it, your baseline, and the lift in points. A path at 71% against a 40% baseline closed nearly twice as often as deals overall — a signal worth investigating, not yet proof of cause.
The sample size beside each path is the most important number after the lift. A +30-point lift across 22 deals is directional; the same lift across 220 deals is structural. A path is flagged when its lift clears a significance test (a two-proportion z-test at p < 0.05); paths without the flag are still worth a look, but the conclusion is softer.
The drop-off shows where deals that started down the winning path but lost stopped progressing. If most losses stalled after Demo, that's where the motion is leaking: those deals completed Discovery and Demo at nearly the rate winners did, but didn't reach Pricing. That gap is the actionable signal.
Known limits you'll see:
"Deals that followed this sequence closed more often. We have not proven the sequence caused the wins — there may be a common upstream factor (deal size, segment, owner). Use this to design experiments, not as final attribution." Always active.
"Only [N] deals matched this path. With a sample this small, the lift is directional, not statistically reliable." Surfaces on small path matches.
"The path uses your tenant's actual stage names. If your stage definitions changed during the period, deals on either side of the change may not be directly comparable." Always active.