Dashboard Creation
Create dashboards from scratch through conversation — describe what you need, the AI builds it, and you take it through a review-and-publish flow built for confidence in every number, today and on every refresh.
What's New
You now have access to the full AI workspace — a chat-based environment where you can work with an AI agent to analyze your data, explore questions, and build outputs.
This release introduces the ability to create dashboards from scratch through conversation. You describe what you need, the AI builds it, and you take it through a review and publish process designed to give you full confidence in the output — both in its accuracy today and its reliability on every future refresh.
What You Can Do
The AI workspace is a general-purpose analytics environment. You can use it for:
- Creating dashboards — the focus of this release, with the full verify, publish, and auto-refresh flow described below
- Ad hoc analysis — ask any data question and get an answer with supporting analysis
- Individual charts — generate specific visualizations to download for presentations or slide decks
- Executive summary reports — create narrative reports with data analysis, export to PDF
The dashboard is the first output type that's fully publishable and refreshable through the platform. Other output types work in the session but don't yet have the same publish and refresh pipeline.
Creating a Dashboard
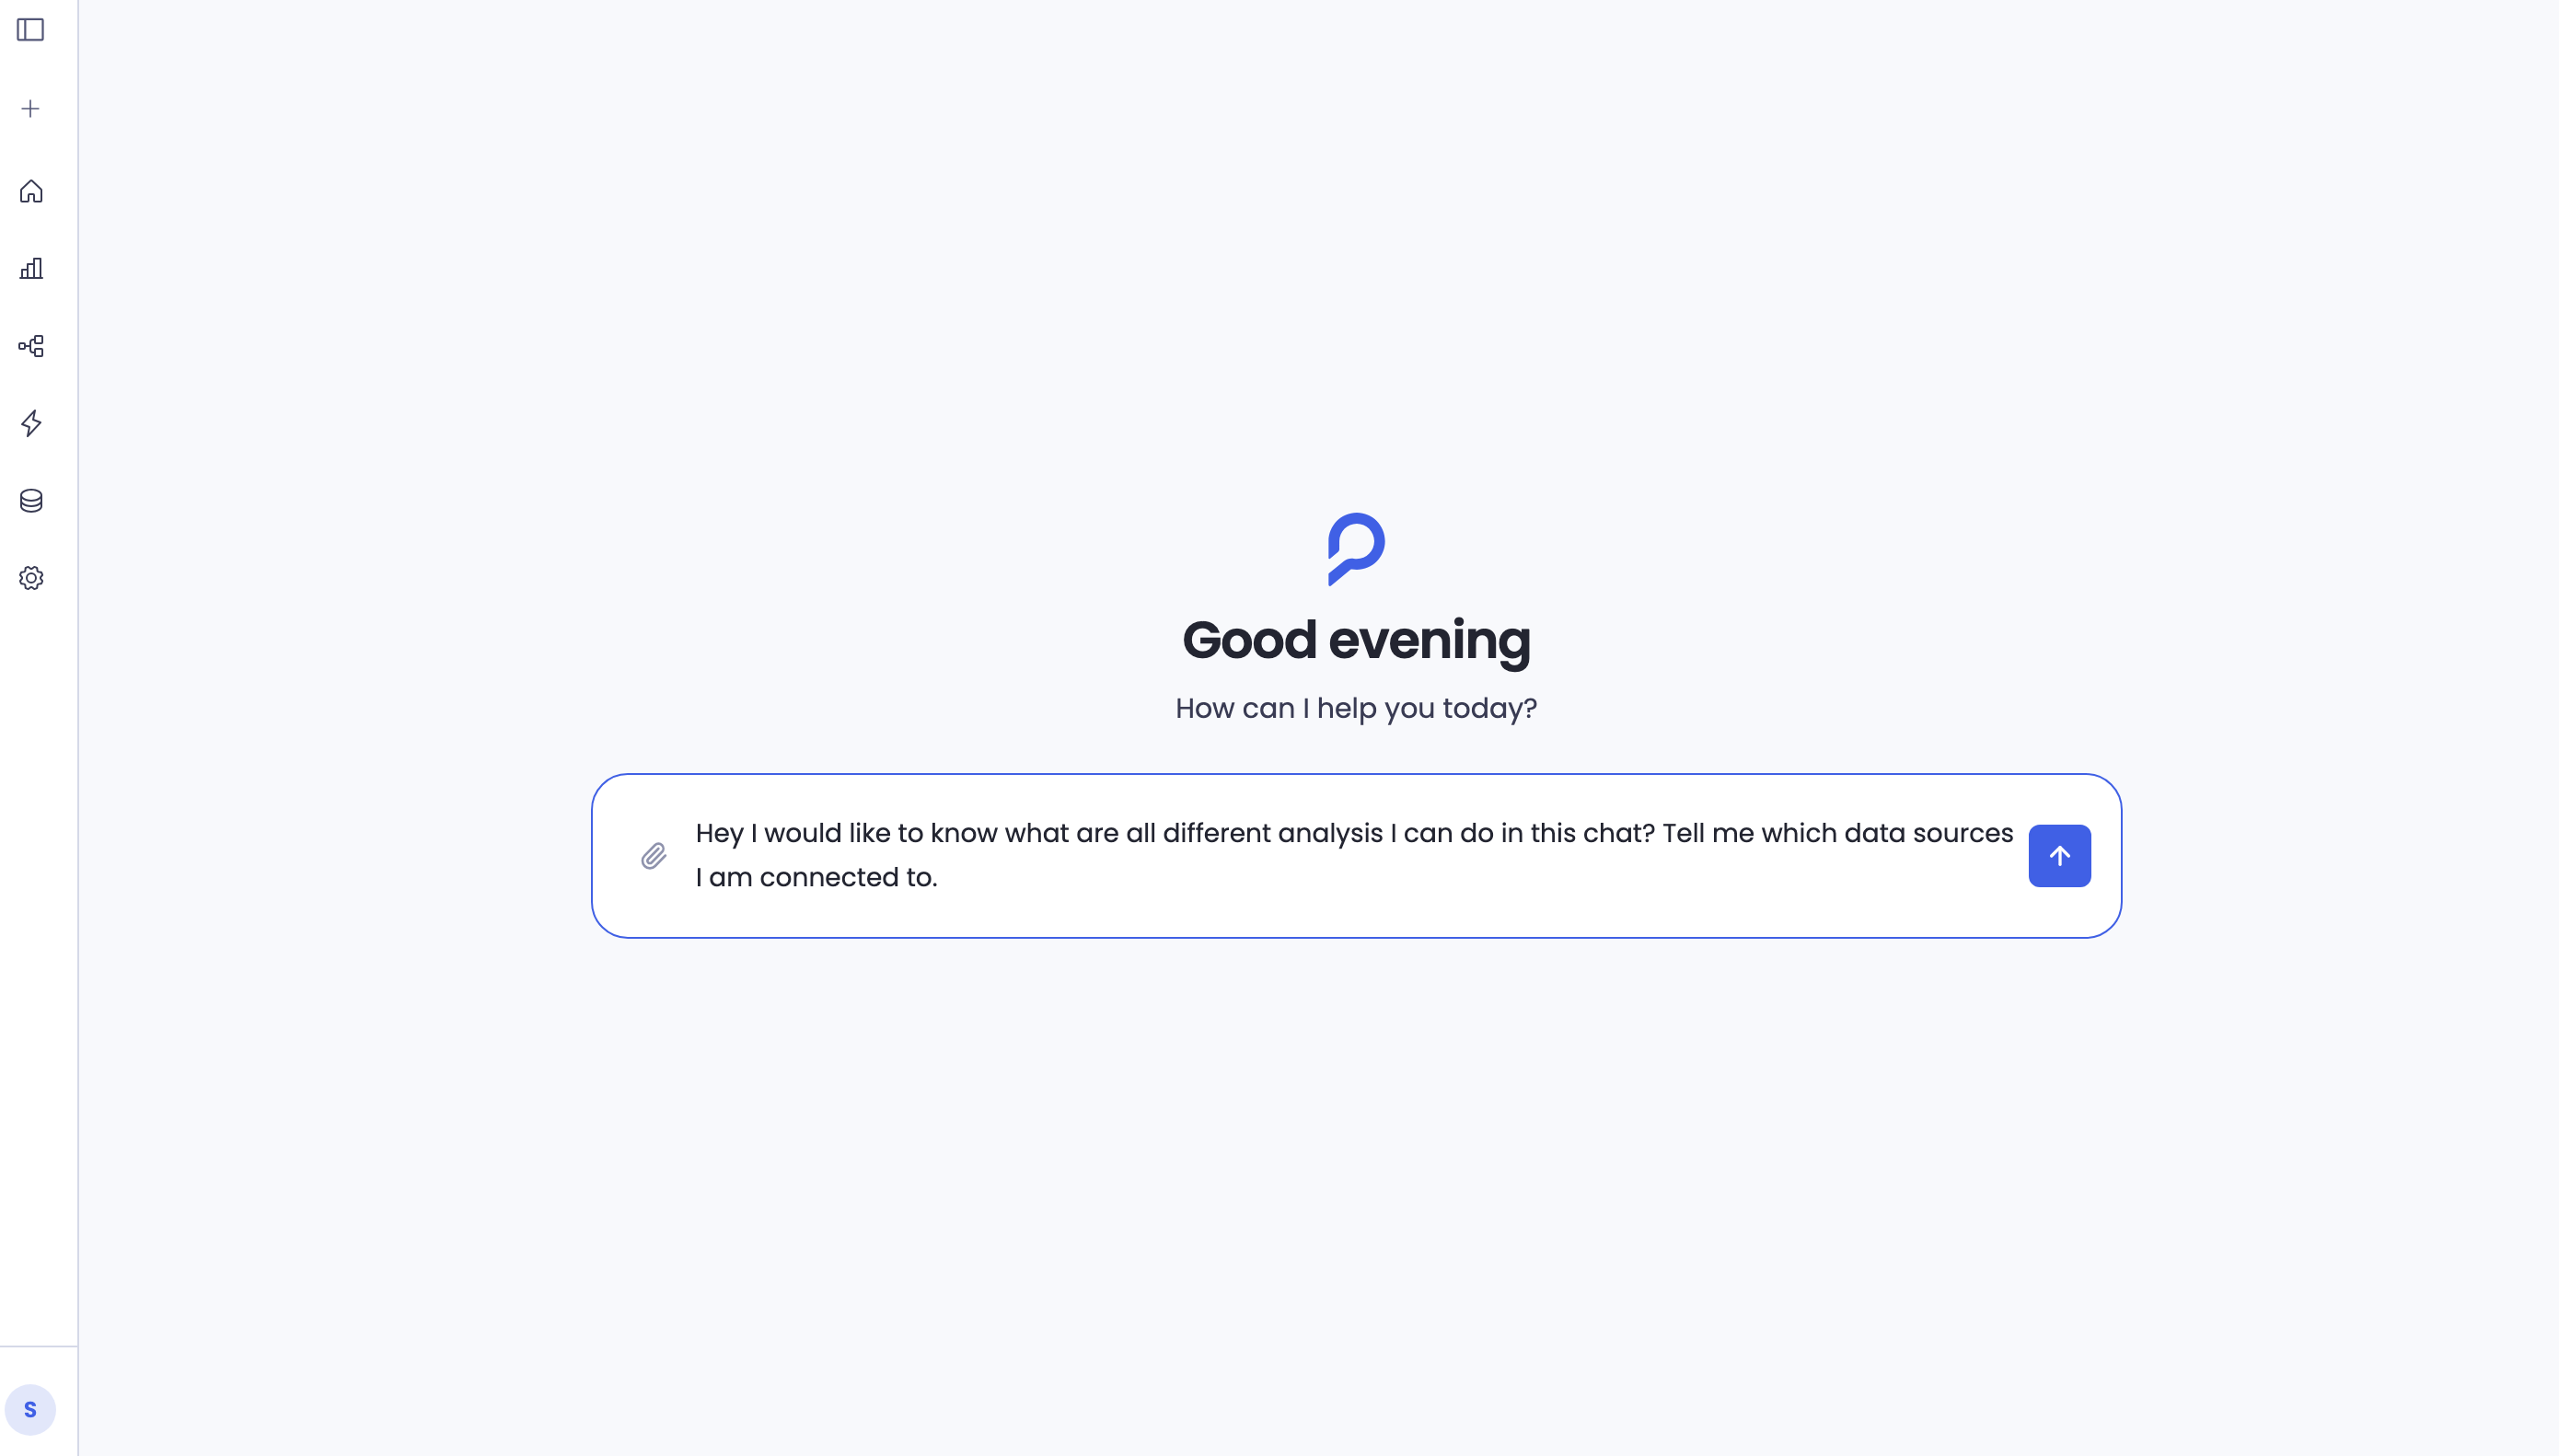
Start a conversation
Open a new session and describe the dashboard you want. Be specific about the data you're working with and what you'd like to see.
"Build me a pipeline health dashboard using our HubSpot CRM data — show win rates, deal velocity, lead sources, and funnel conversion over the last 2 years"
"Create a marketing performance dashboard that tracks lead volume, qualification rates, and campaign attribution by source"
"I need a sales activity dashboard showing rep-level calls, meetings, and deal progression quarter over quarter"
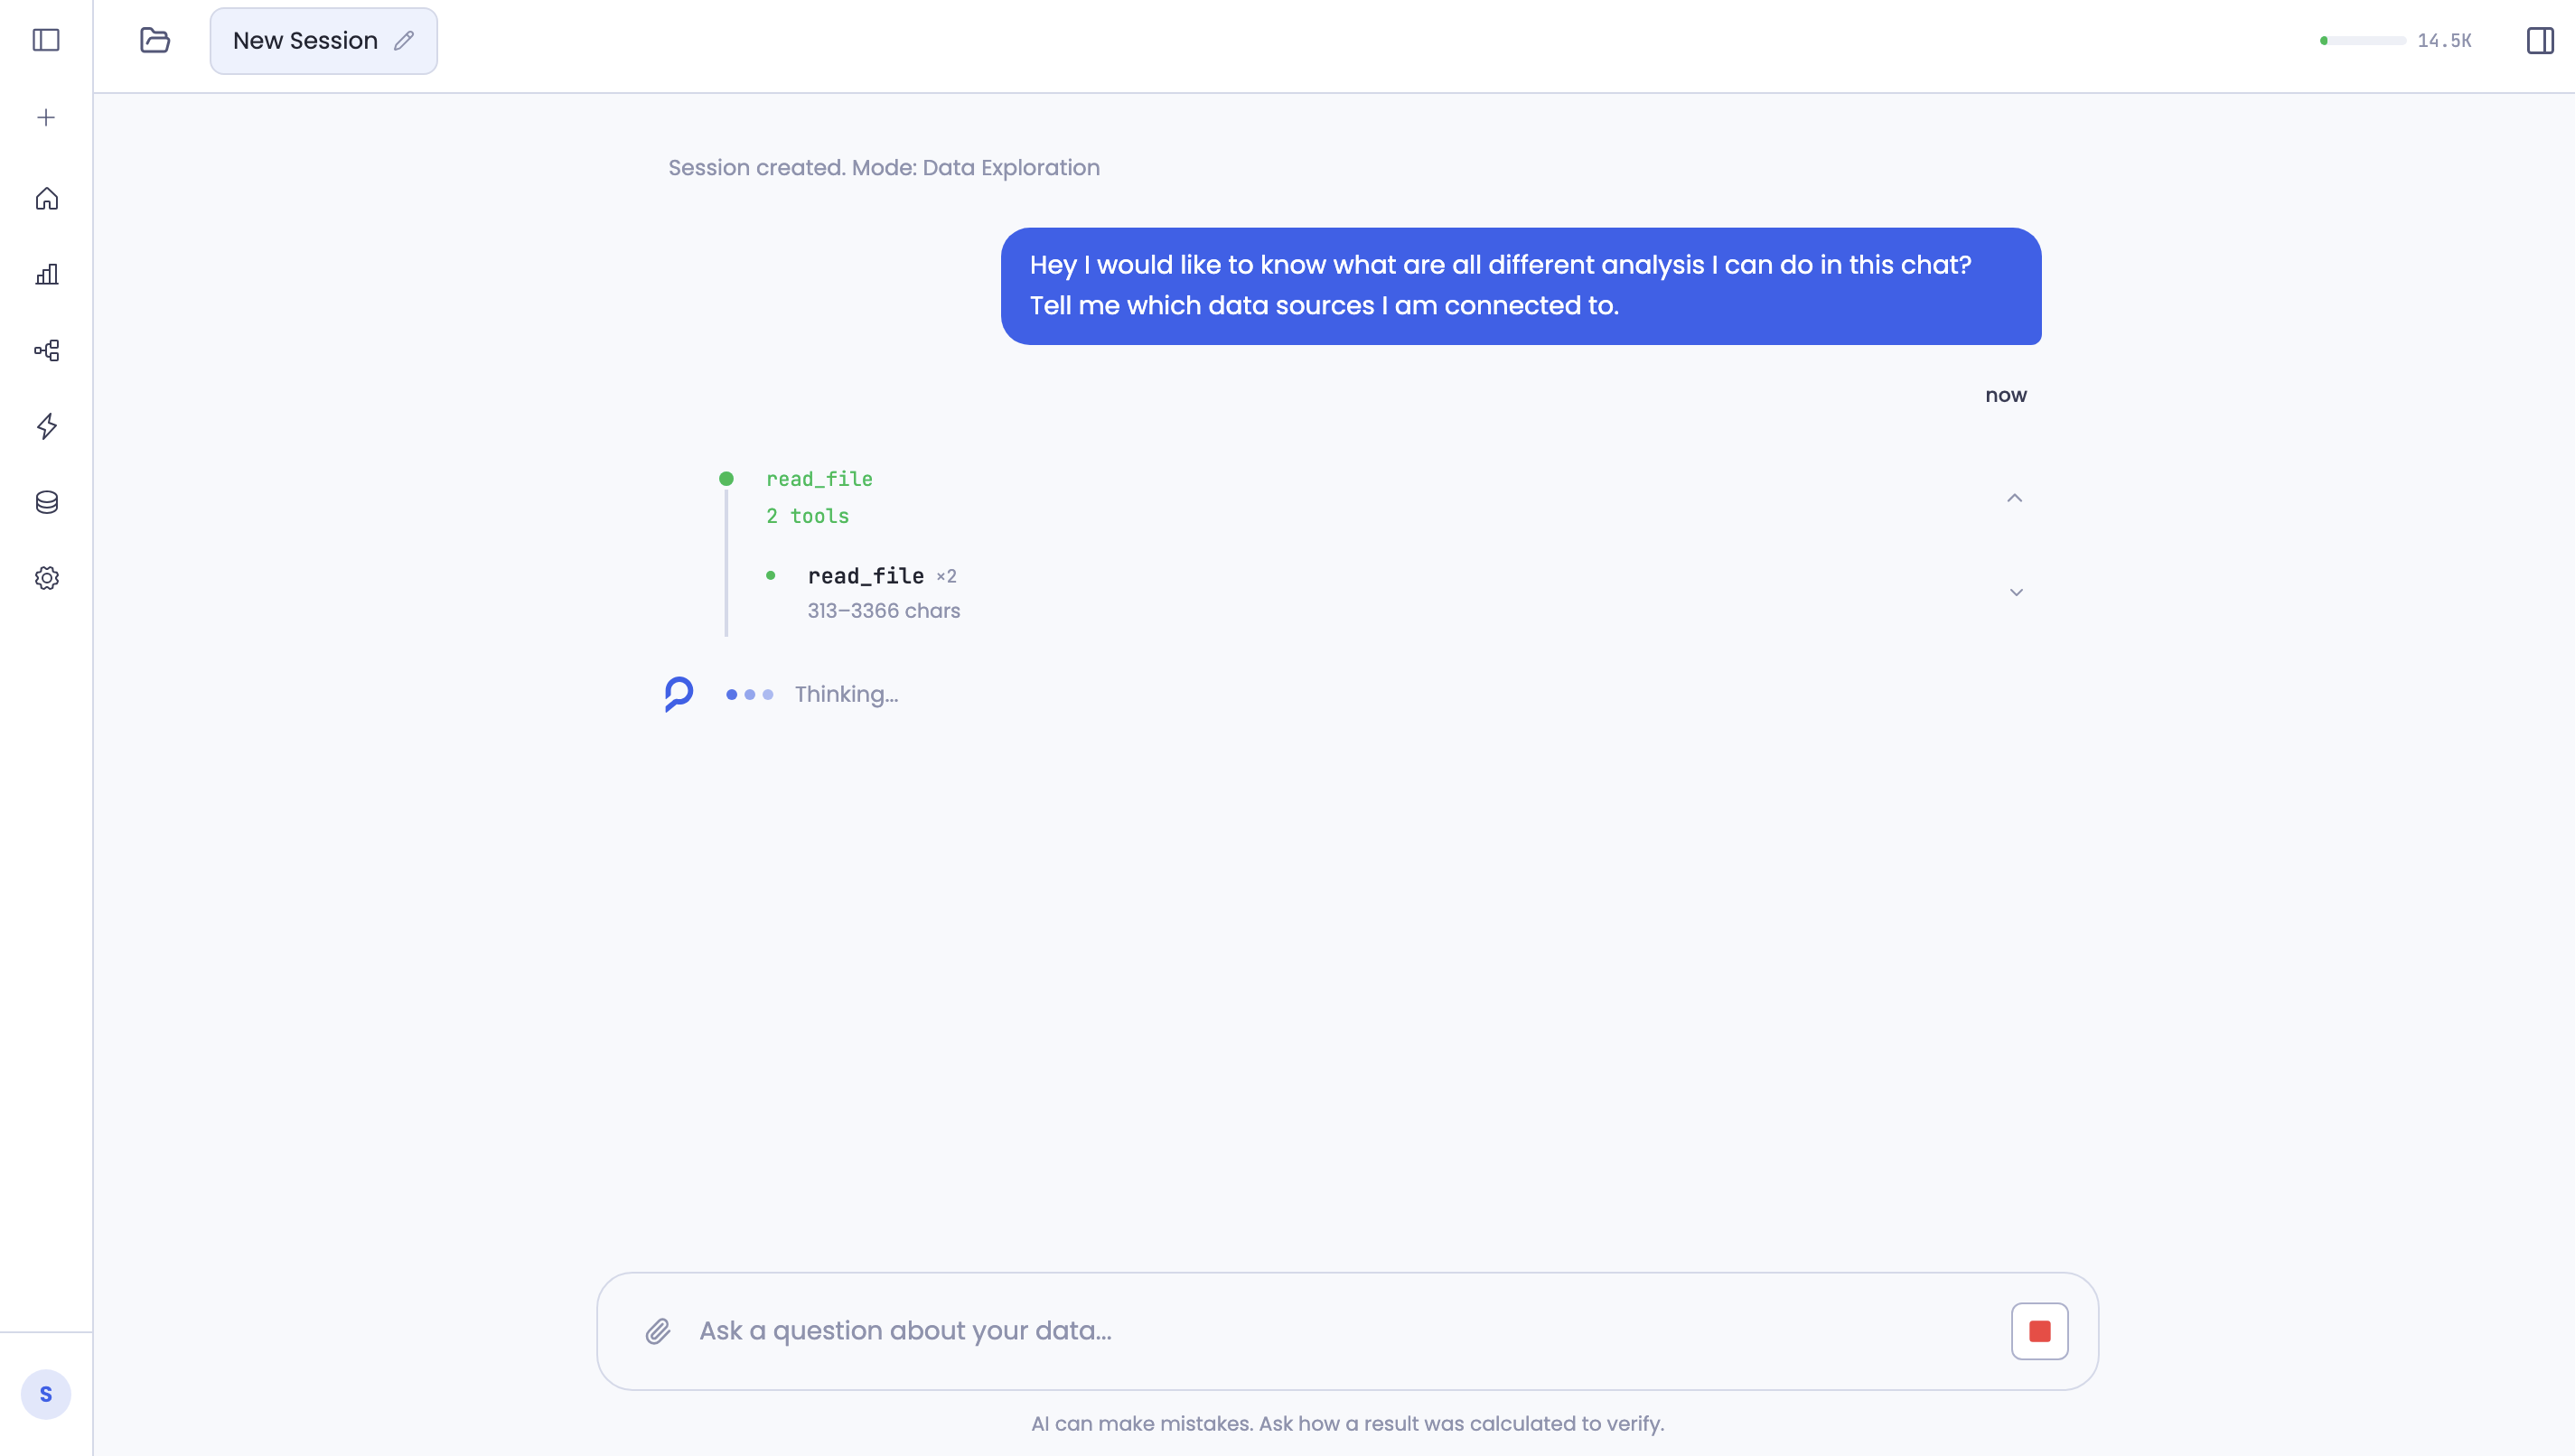
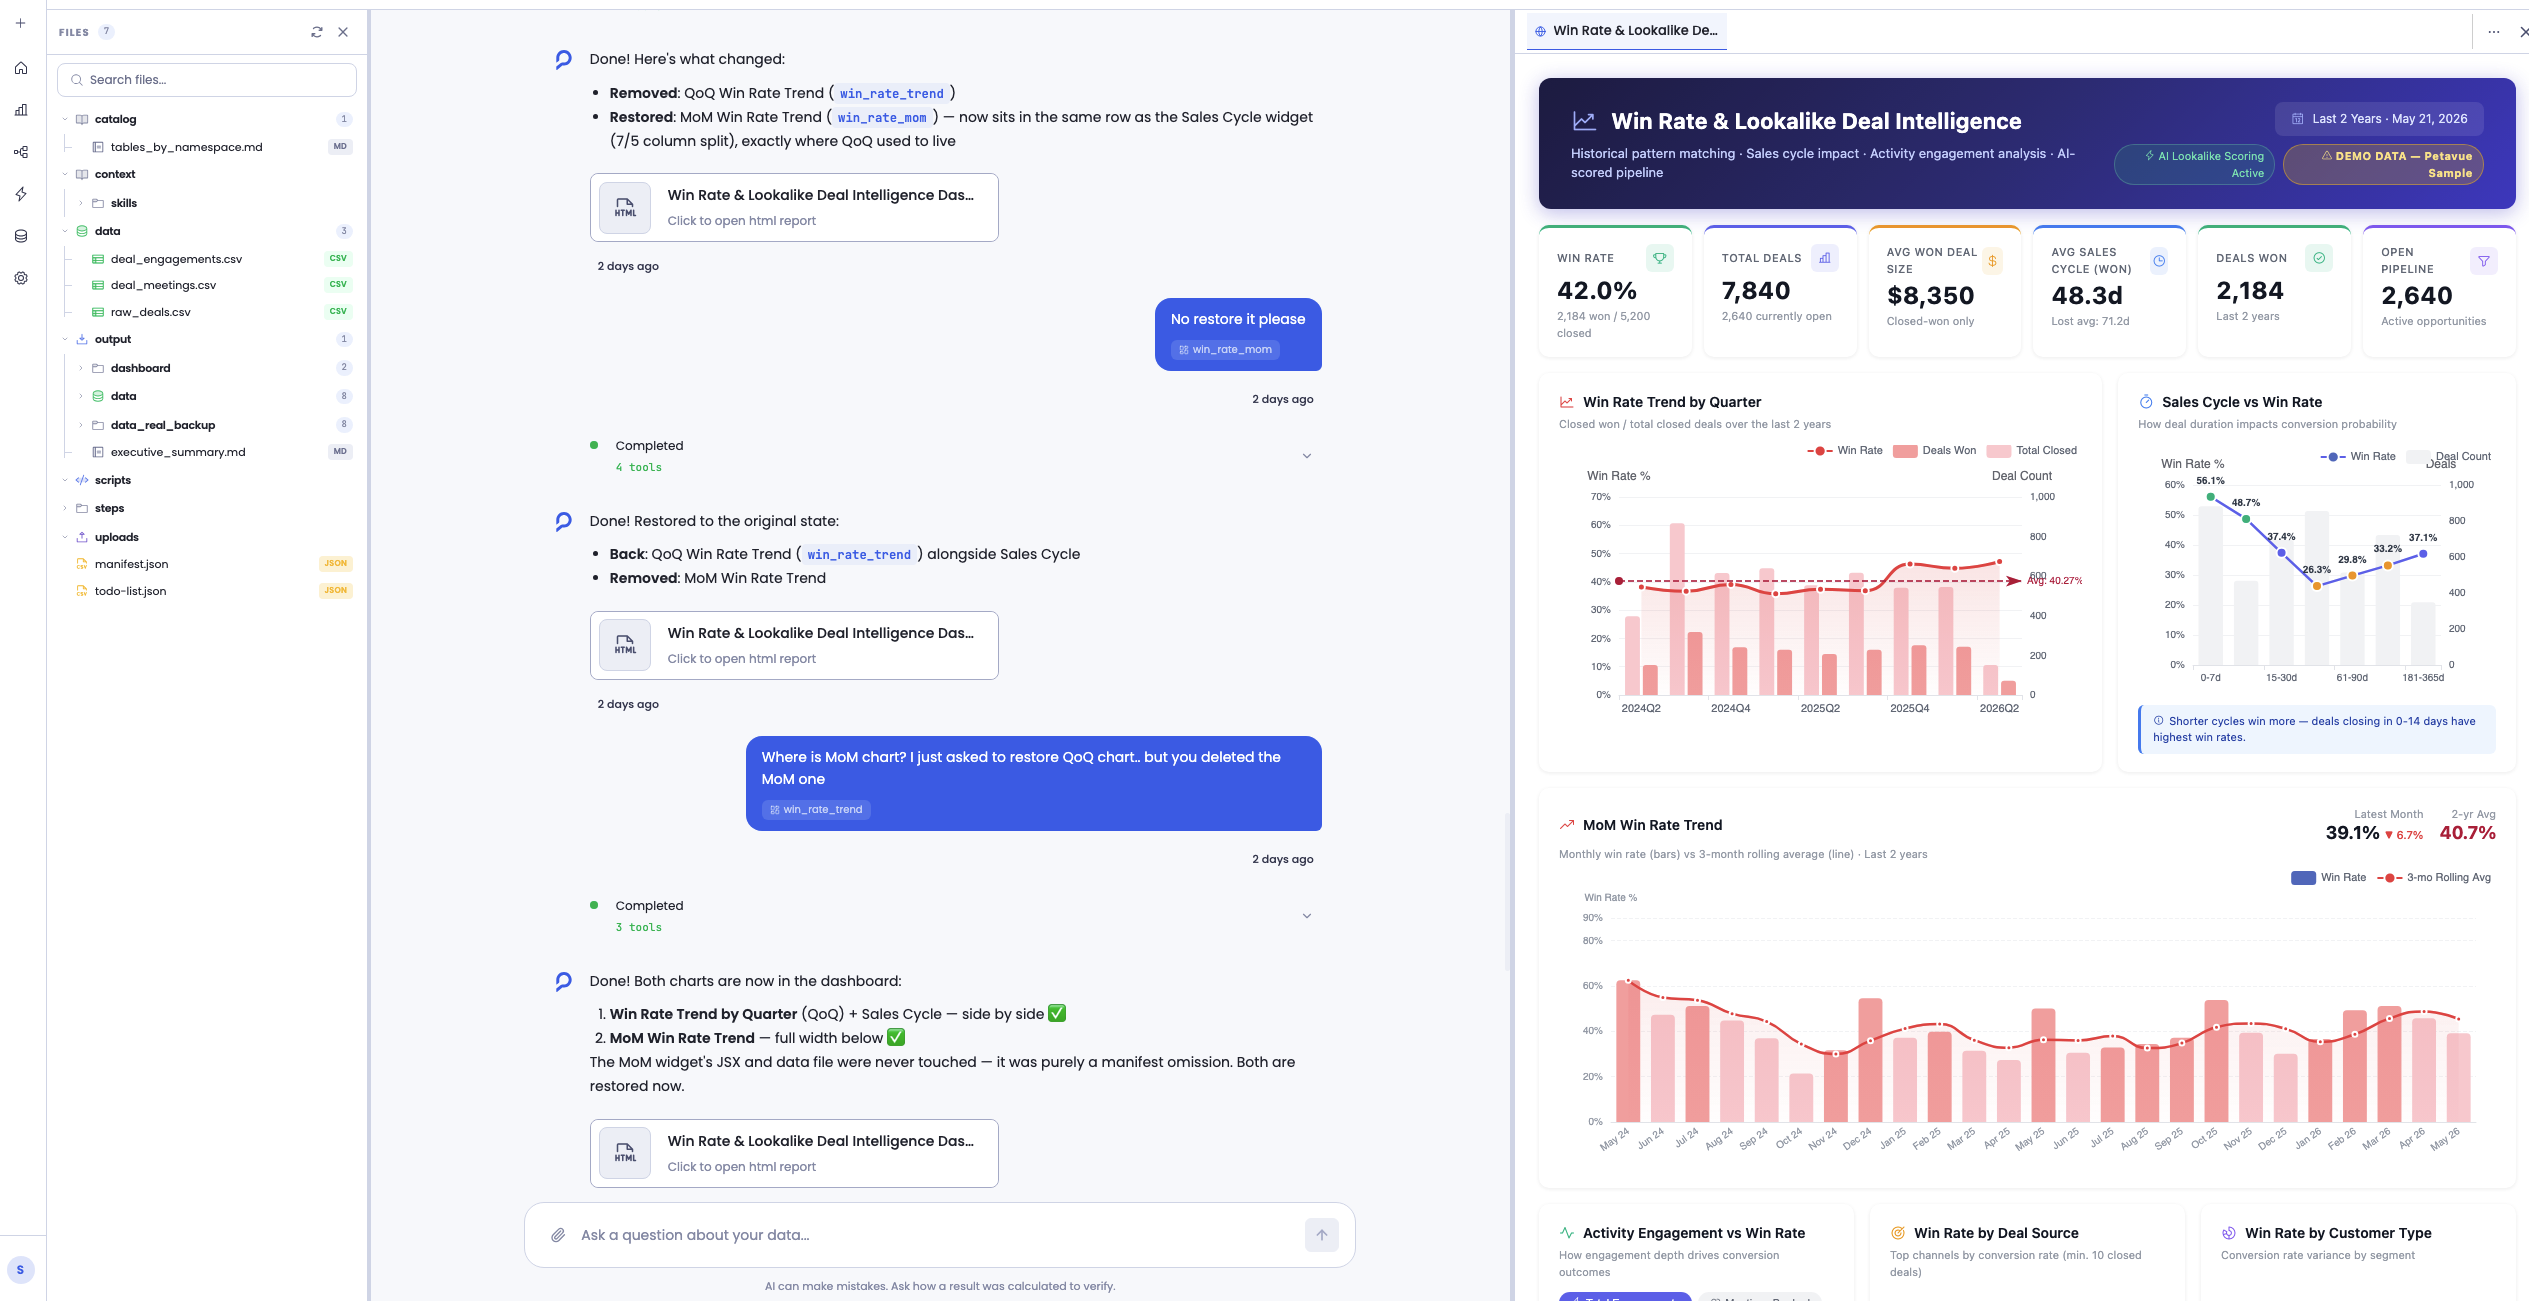
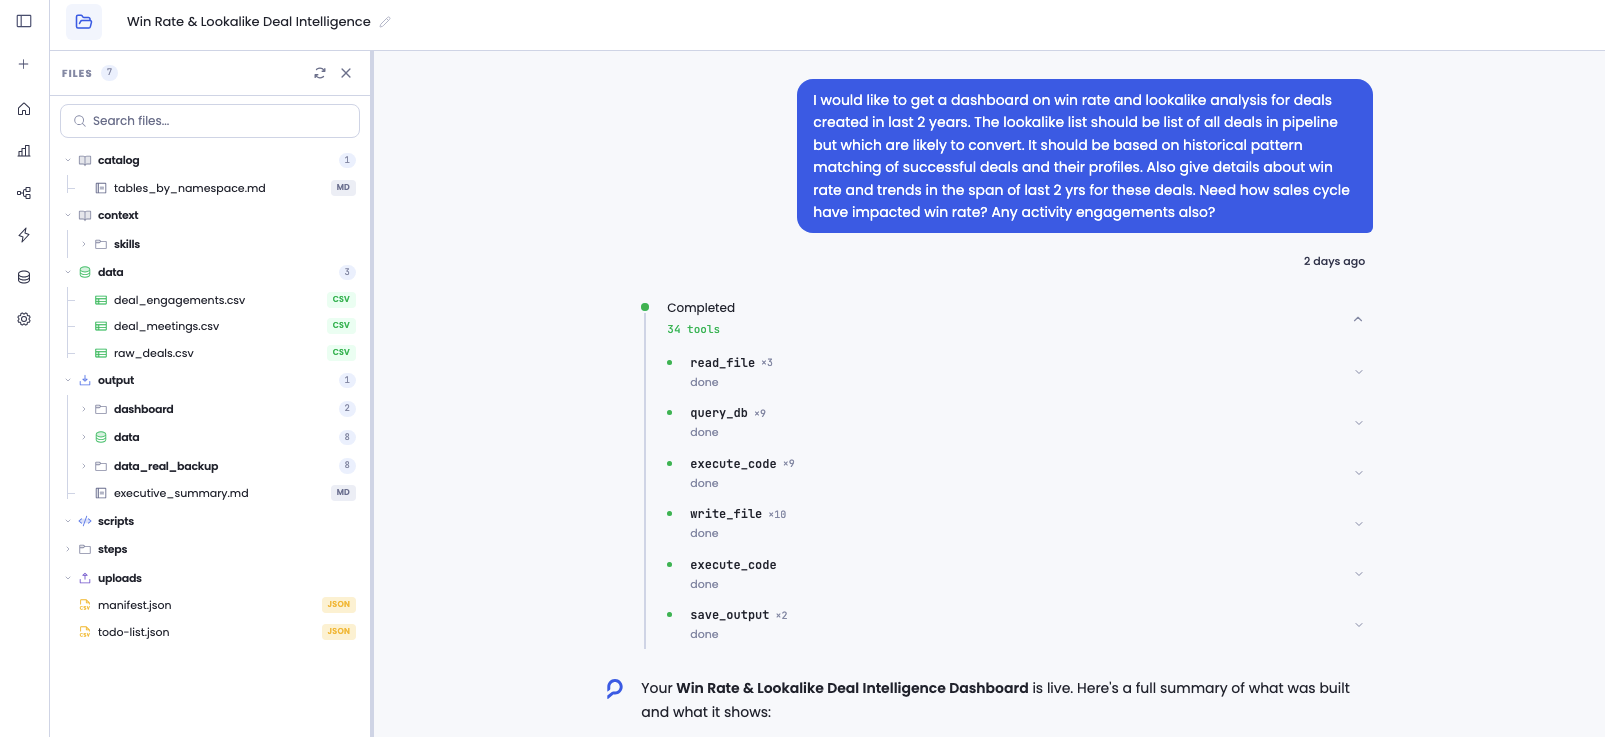
The AI will start building your dashboard — creating data queries, running calculations, and generating widgets (KPI cards, charts, tables, funnels). You'll see the dashboard take shape in the preview panel as the conversation progresses. You can ask for changes along the way — add widgets, adjust calculations, change colors, modify filters.
Review your dashboard (Verify)
Once you're happy with the dashboard in the session, the next step is to review and publish it. This happens across two pages, each with a different purpose:
Verify
You check each widget to make sure the data, calculations, and visuals are what you expect.
Publish
When auto-refresh is enabled, an AI agent checks that your dashboard can refresh reliably on every scheduled run. Any changes it makes are shown to you before anything goes live.
One ensures the dashboard is accurate. The other ensures it stays accurate over time.
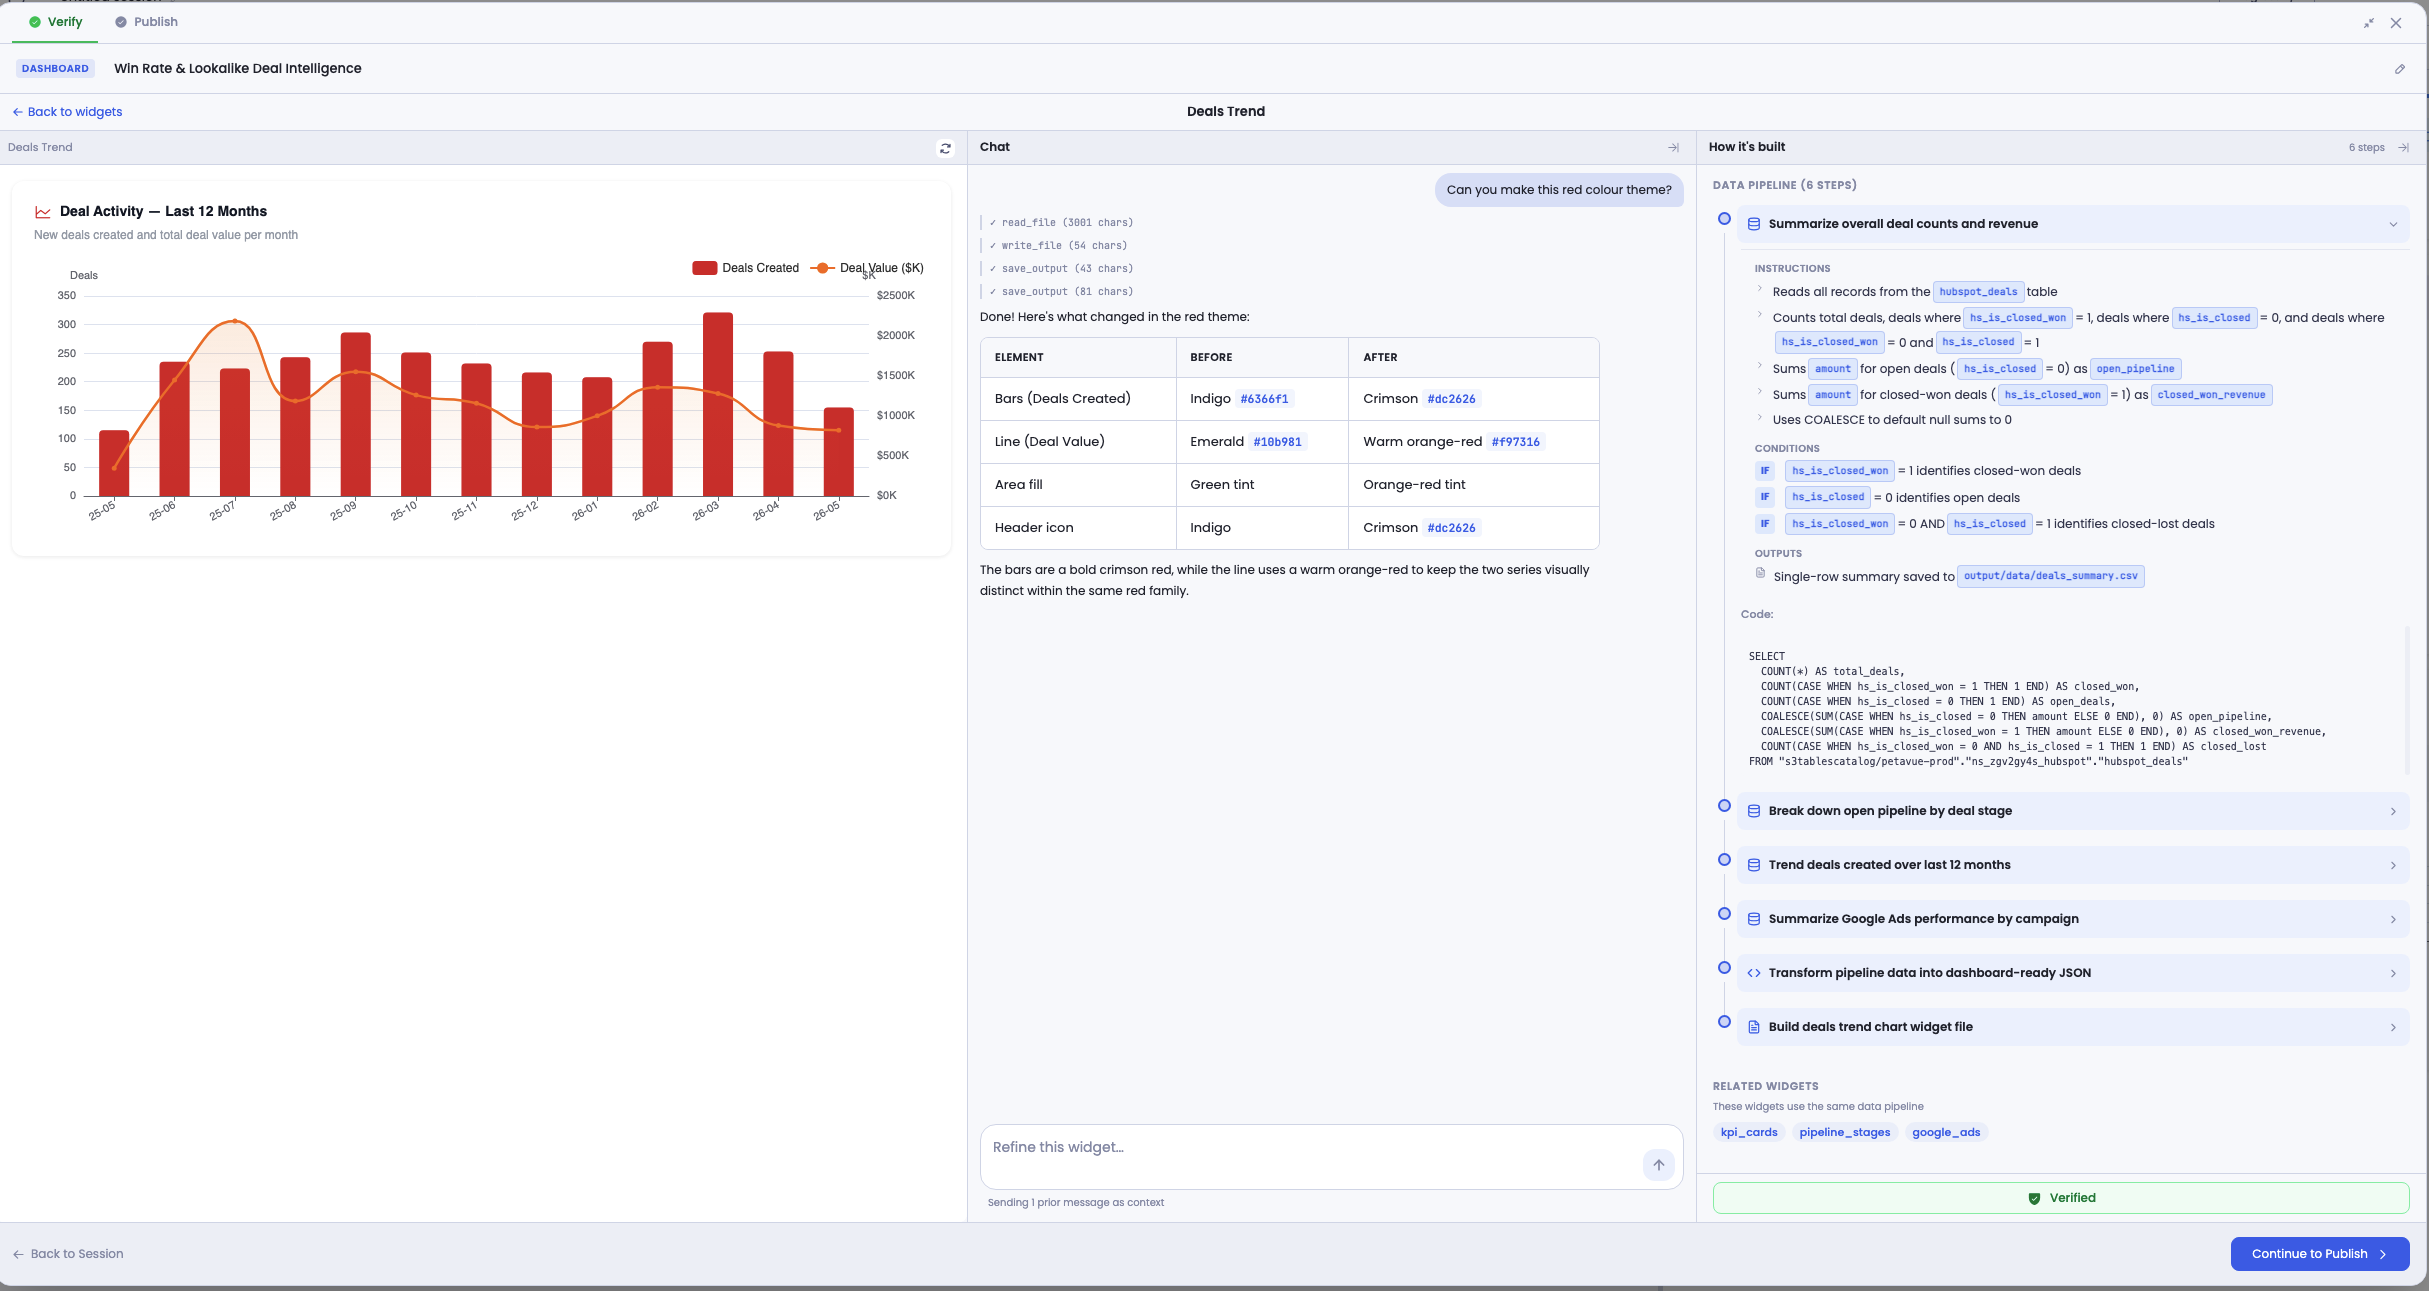
Click Verify & Publish to open the review page. You'll see all your widgets listed. Click any widget to drill in — you get:
- A preview of the widget with live data
- A "How it's built" panel showing the data pipeline — every query, calculation, and transformation that produced this widget
- A scoped chat where you can make changes to that specific widget — adjust calculation logic, change colors, modify layout, update data filters, or anything else about that widget
Verification is not compulsory. You don't have to go through every widget and mark it verified before you can publish. Some widgets you'll feel confident about already. The checkboxes are there as a tracking tool — a focused way to keep track of what you've reviewed and what you haven't. How much you verify is entirely up to you.
When you're ready, click Continue to Publish.
Publish
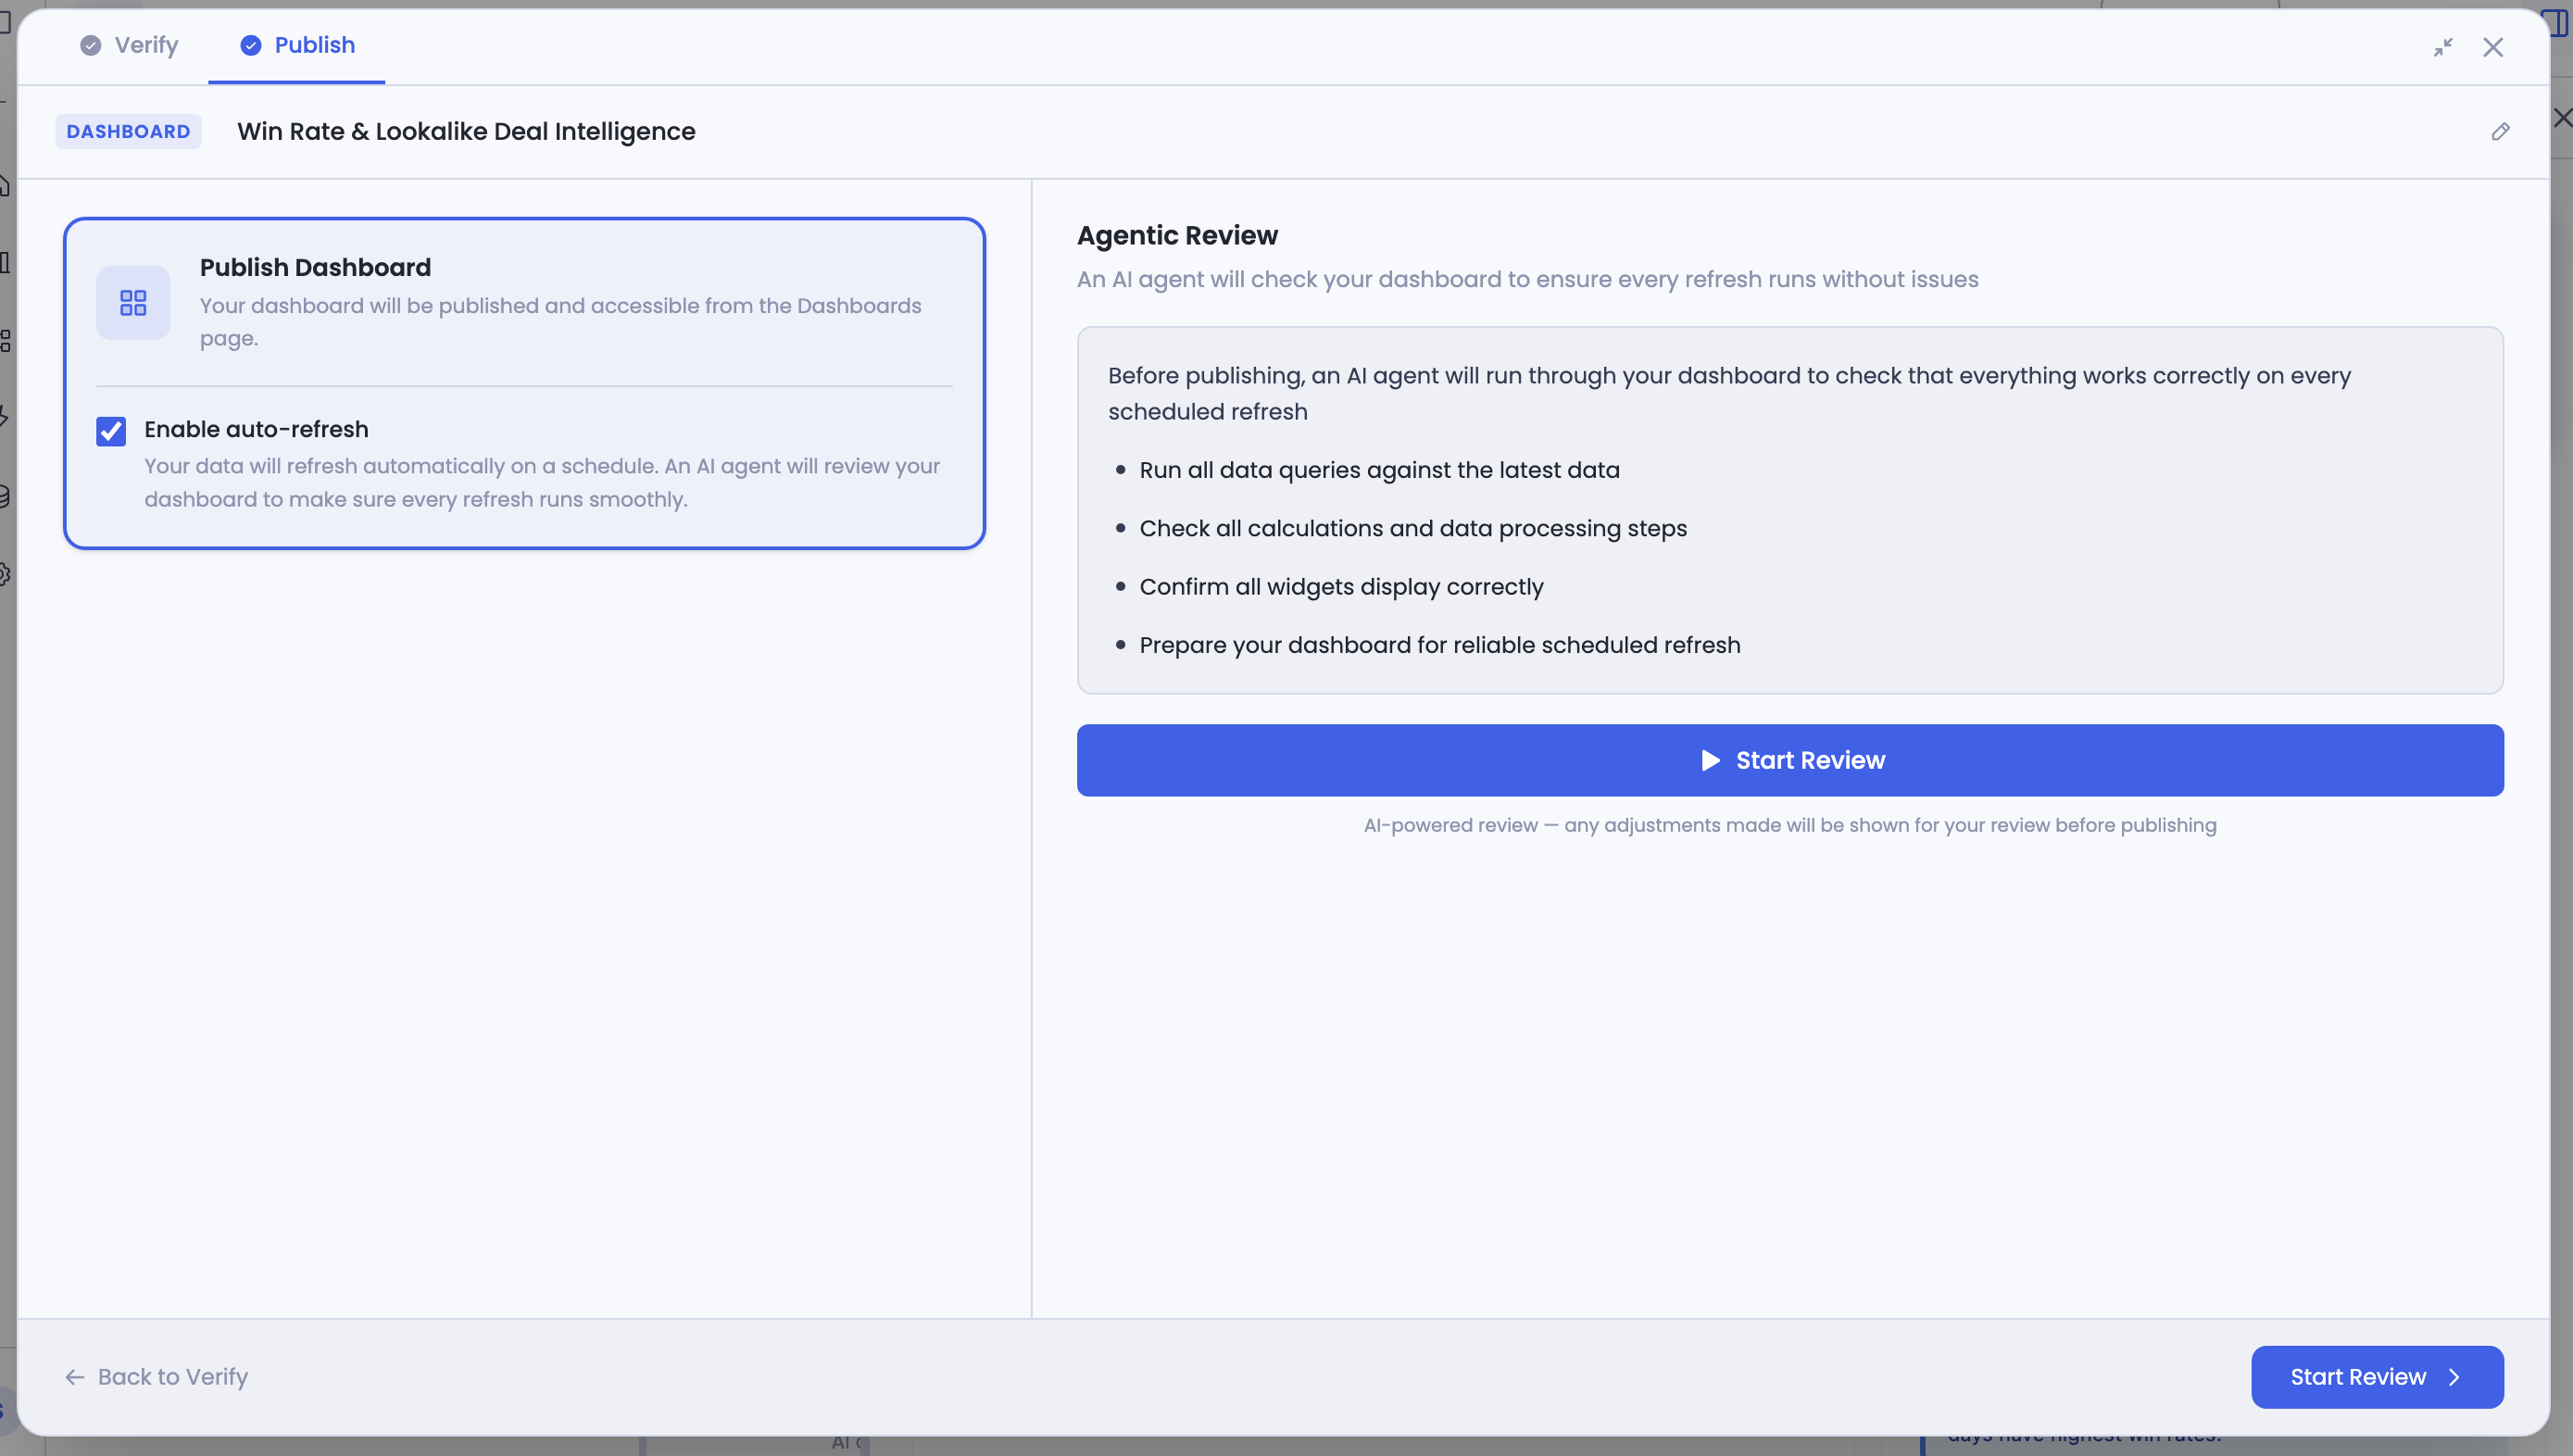
On the Publish page, you'll see your dashboard settings on the left and the AI review panel on the right.
Choose how to publish:
- Without auto-refresh — your dashboard is published as a static snapshot. It captures your data as it is right now and won't update automatically. The AI runs a quick set of checks to confirm everything works correctly, then publishes. Choose this if you need a point-in-time view or don't need scheduled updates.
-
With auto-refresh — two things happen:
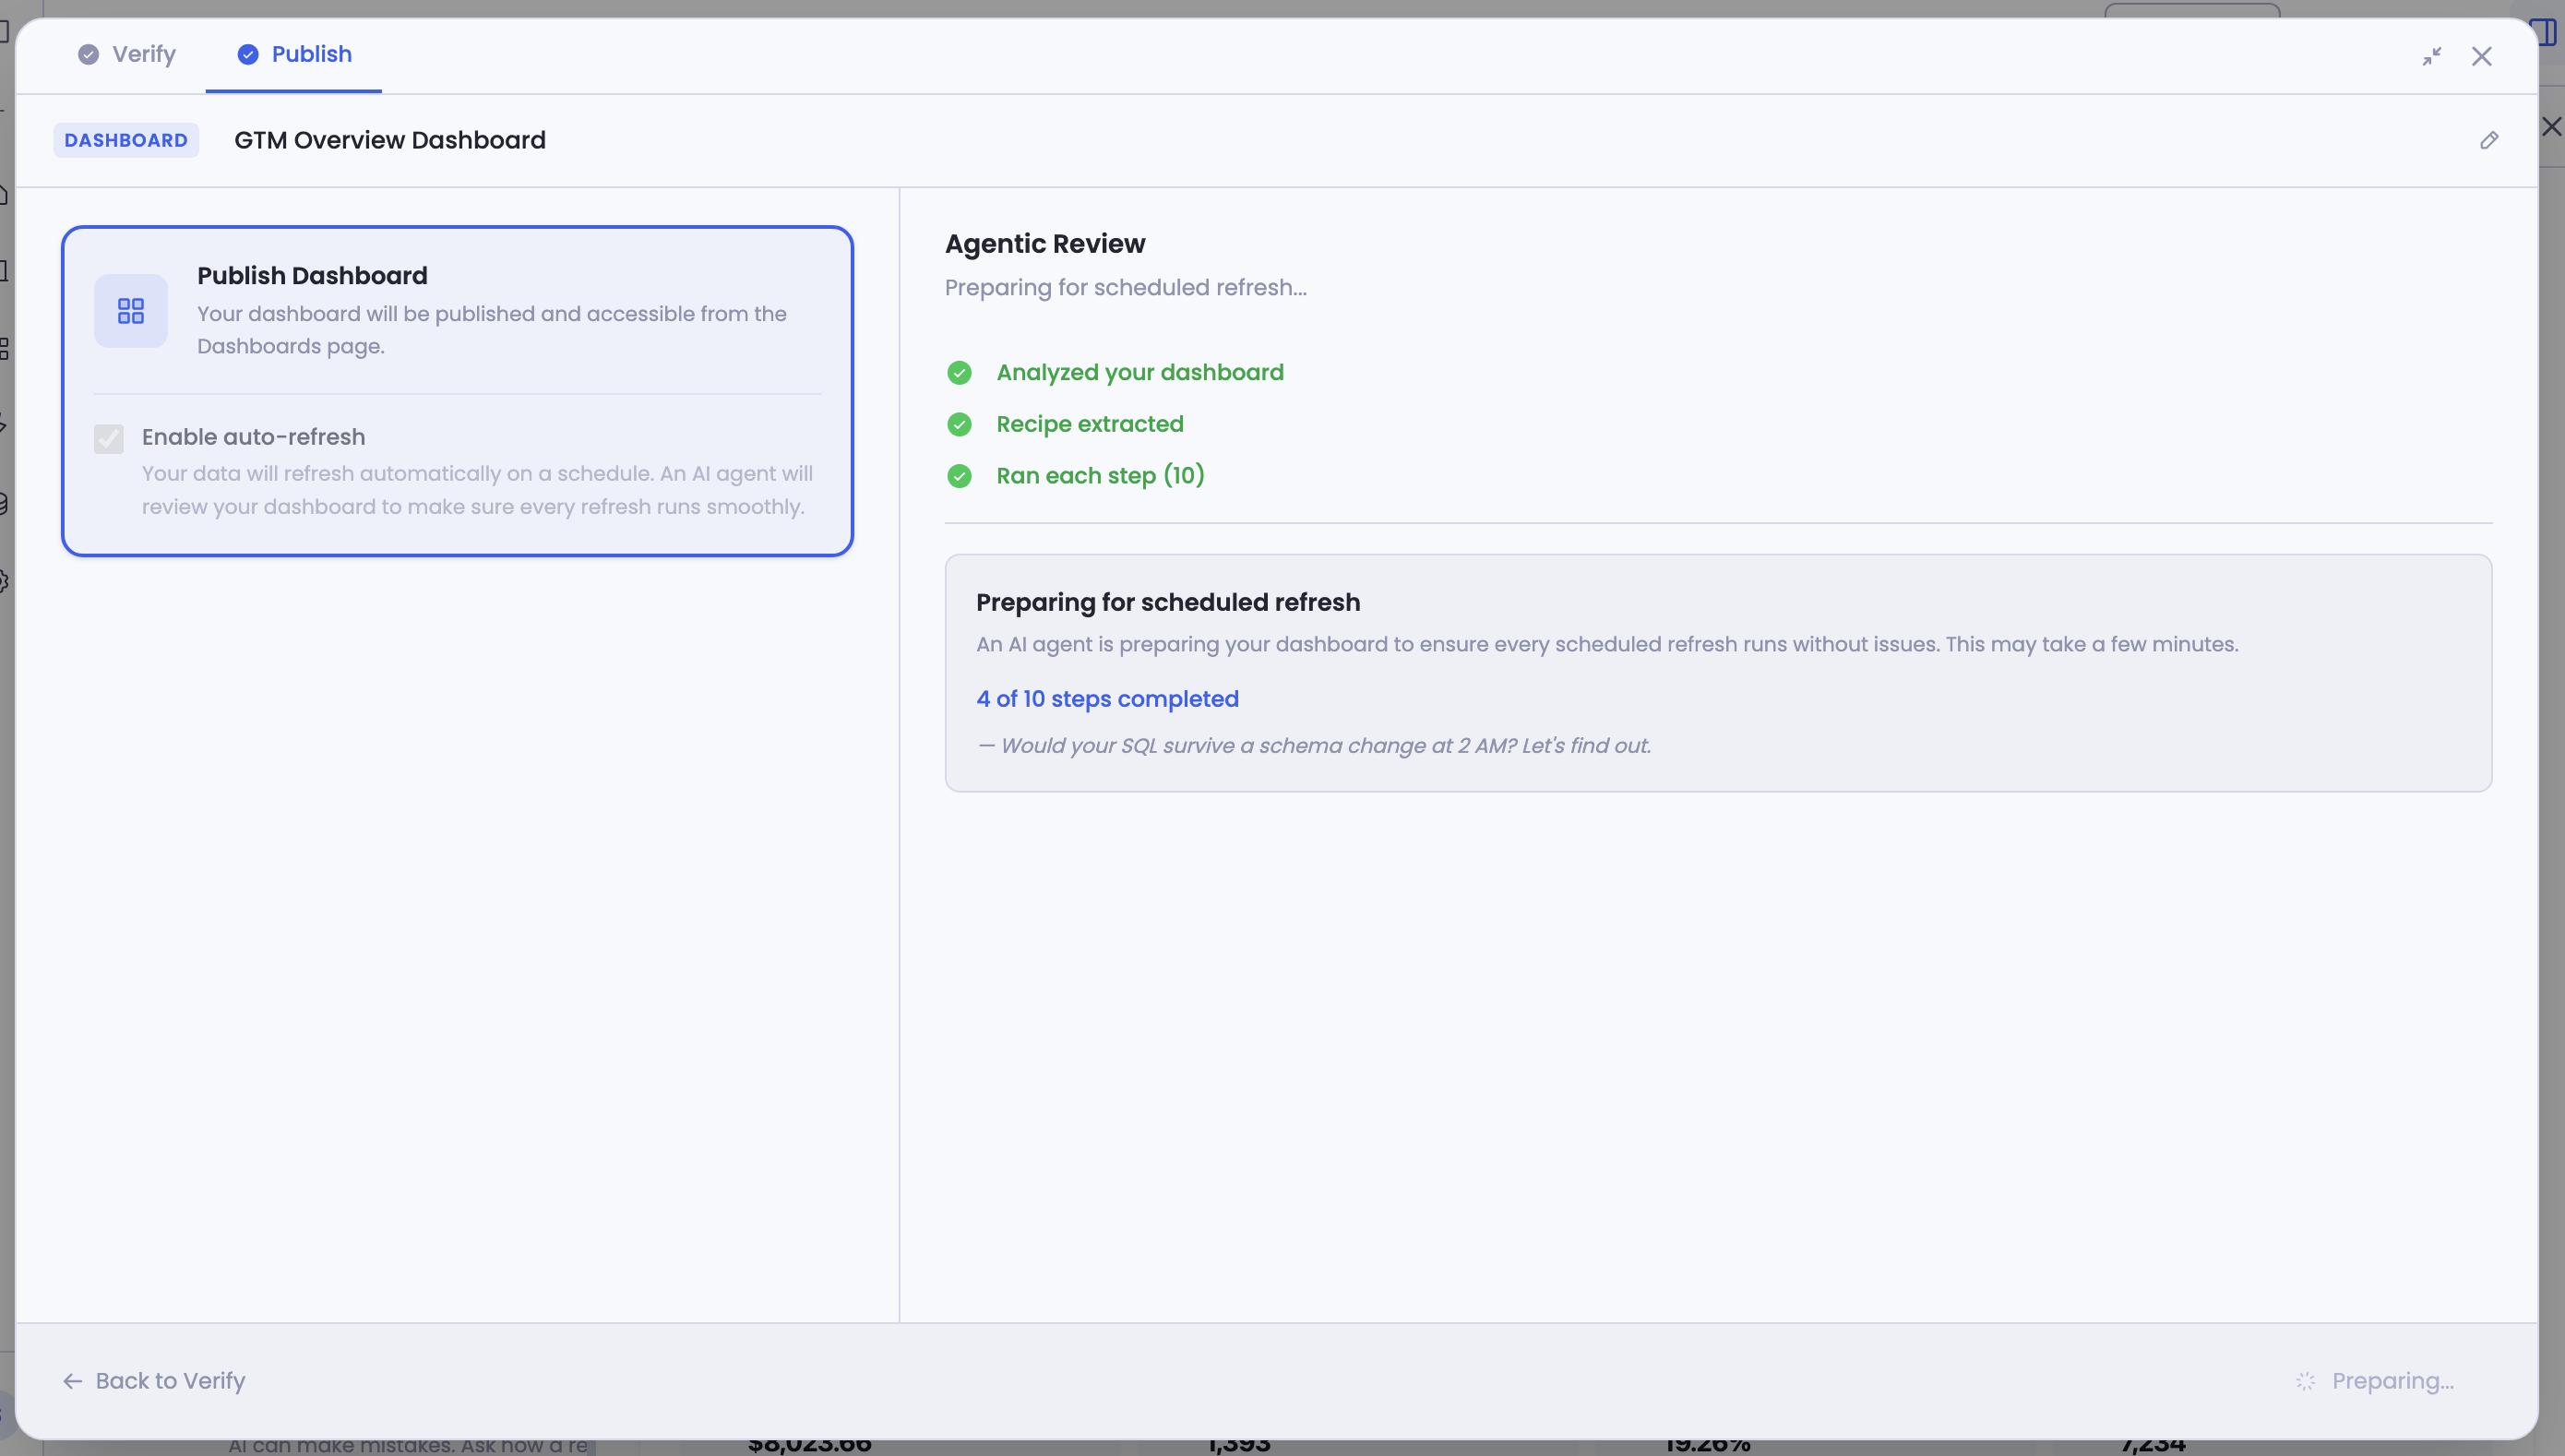
- The AI extracts the recipe. Every data query, calculation, and transformation that goes into producing your dashboard is pulled out and organized into a sequence of steps — the recipe. Think of it as the list of ingredients and instructions behind your dashboard. Once extracted, this recipe is what powers every future refresh — it runs independently of the original chat session.
- The AI prepares the recipe for scheduled refresh. It reviews each step to make sure it can run reliably on every future refresh. This means catching things like dates that shouldn't be fixed to a specific day, calculations that could break on missing data, and other issues that would cause a refresh to fail silently. Unless you've intentionally hardcoded something, the agent will adjust it to be dynamic.
This preparation phase takes a few minutes depending on the number of steps in your dashboard. You can wait and watch, or leave and come back — the process continues in the background.
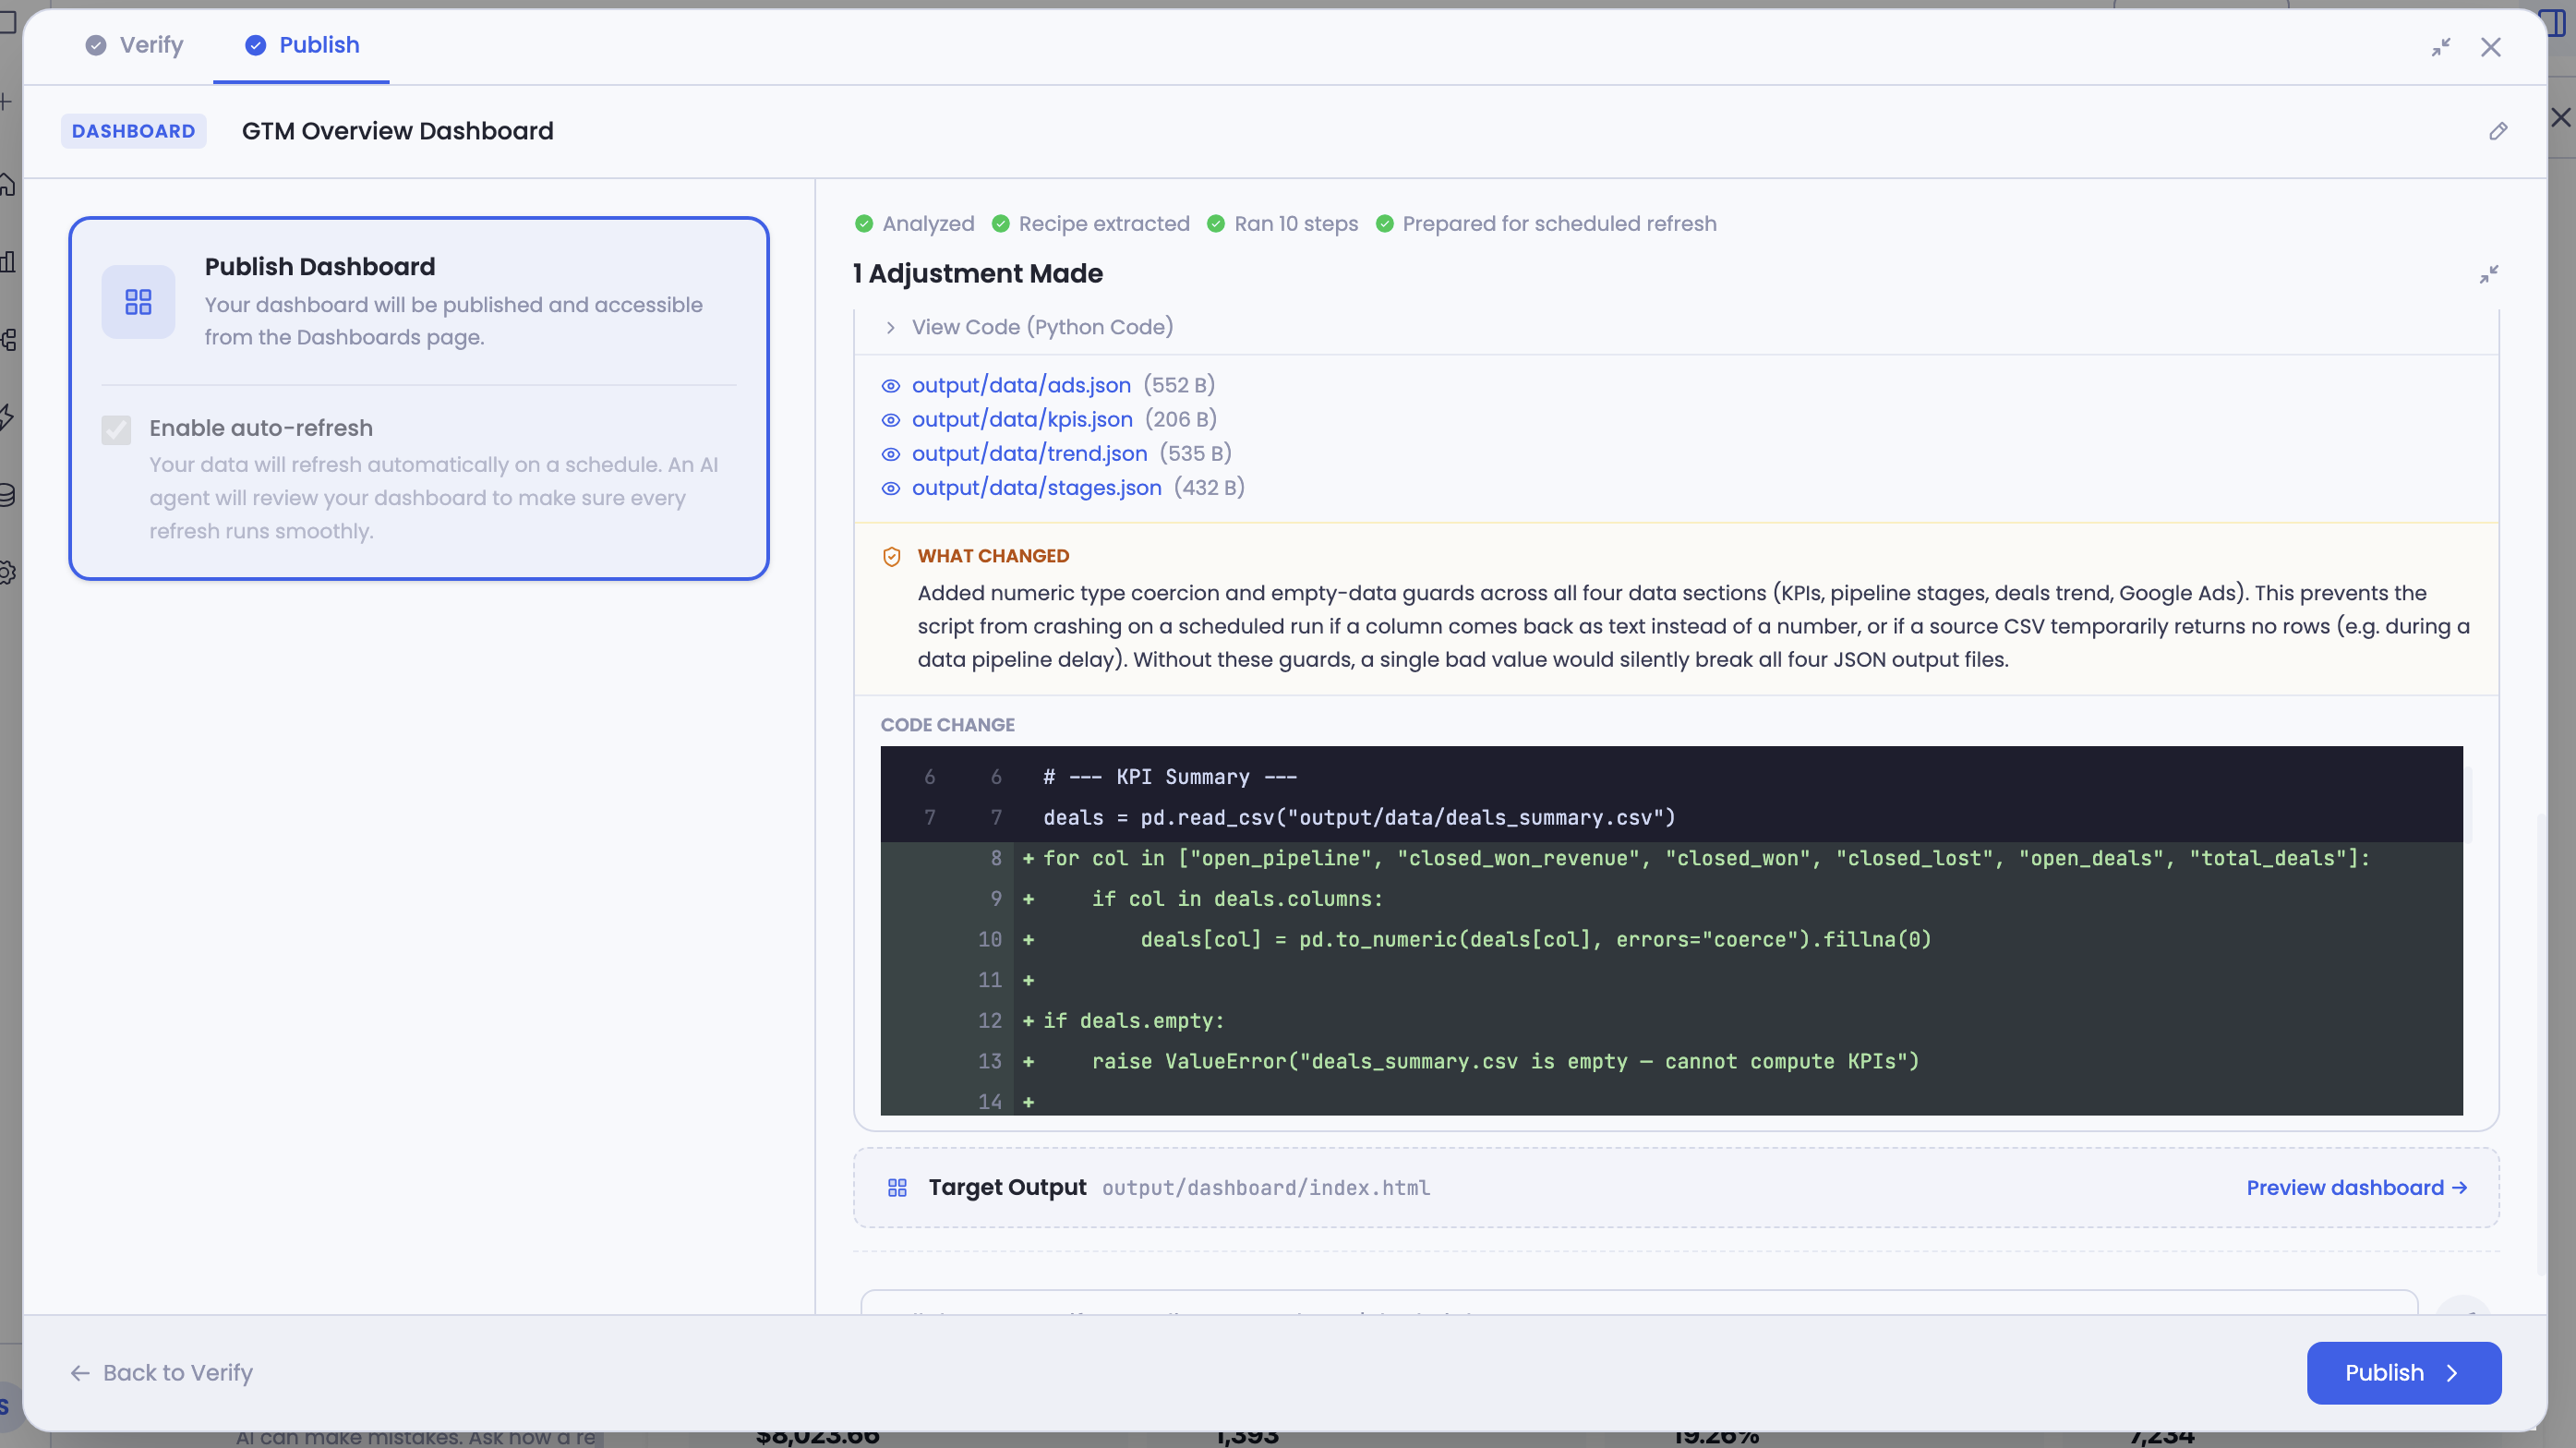
When it's done, you'll see only the steps the agent adjusted — a summary of what changed and why, with the actual code diff. You review them, give feedback if something doesn't look right, and when you're satisfied, hit Publish.
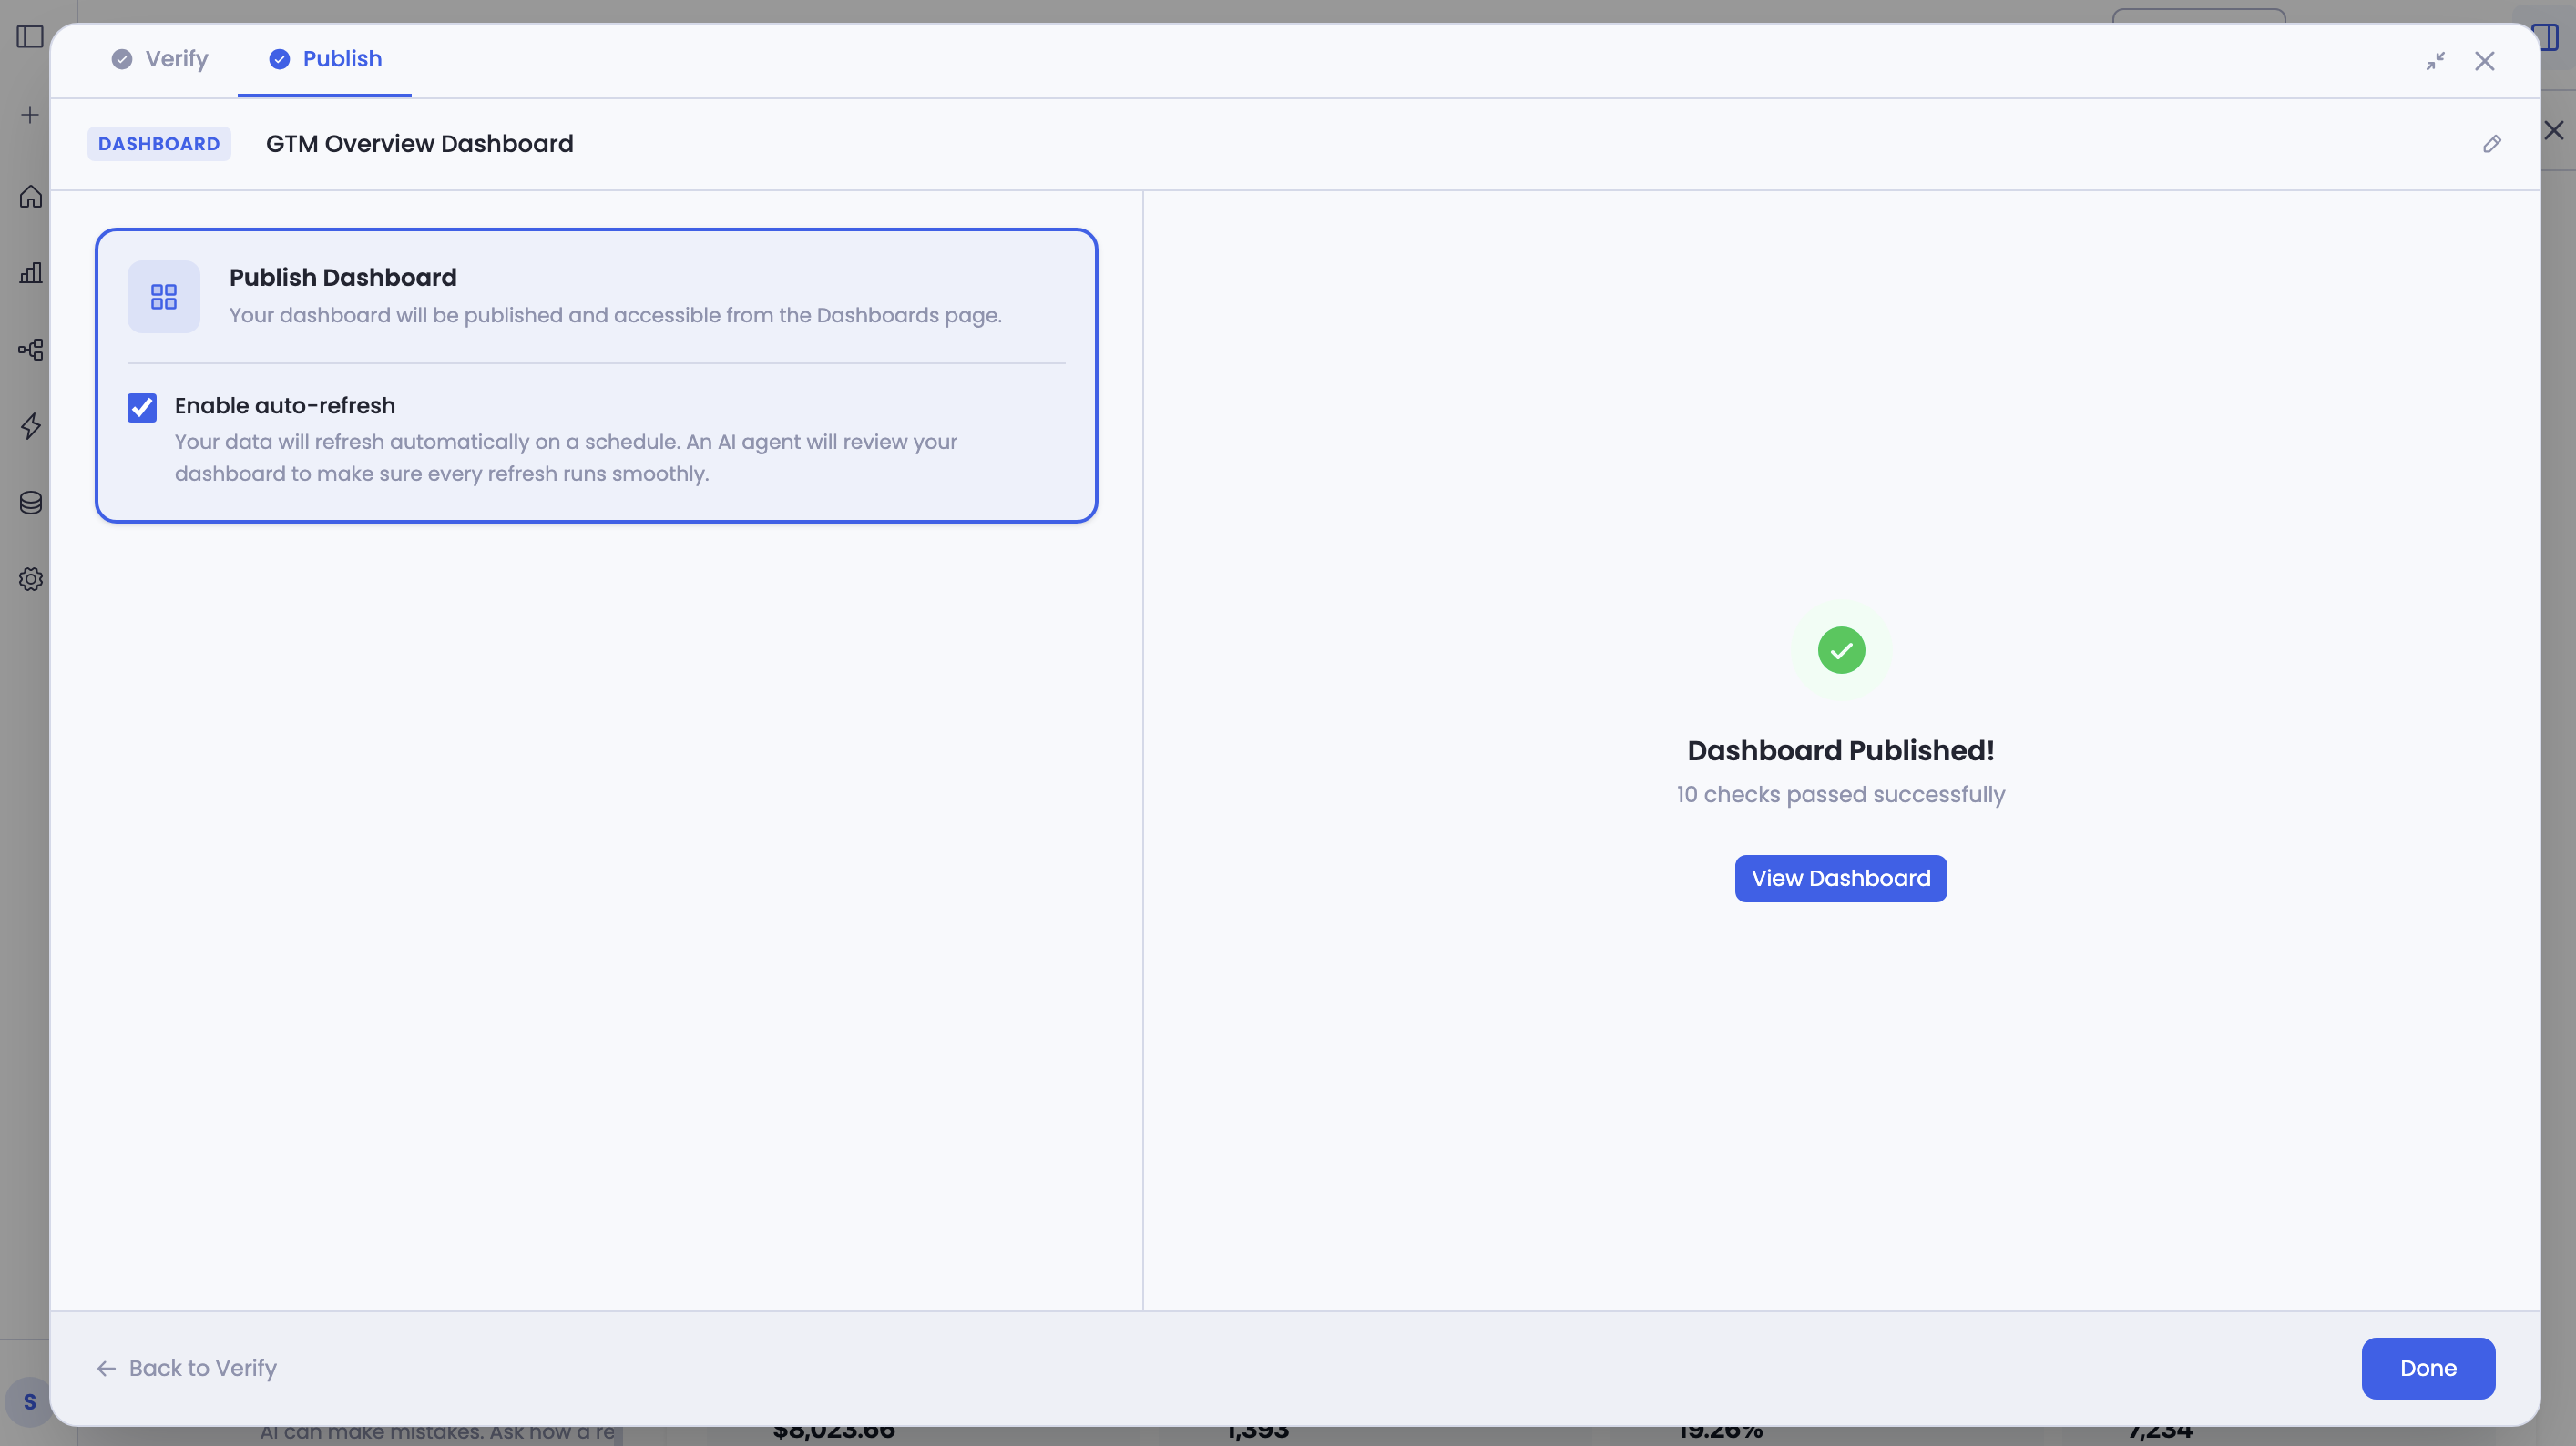
Your dashboard is now live. It appears on your Dashboards page, and if auto-refresh is enabled, it will update on the scheduled cycle automatically.
Editing a Published Dashboard
There are two ways to get to the session where your dashboard was built:
- Go directly to the session from your recent sessions list
- From the Dashboards page — find the dashboard you want to edit, open the menu, and select Source Session. This takes you to the original chat session where the dashboard was created.
Once in the session, make your changes through the conversation — add widgets, modify calculations, update filters, change the layout. When done, click Verify & Publish again.
On the Verify page, your previous verification progress is preserved — widgets you already verified will still show as verified, so you only need to focus on what changed.
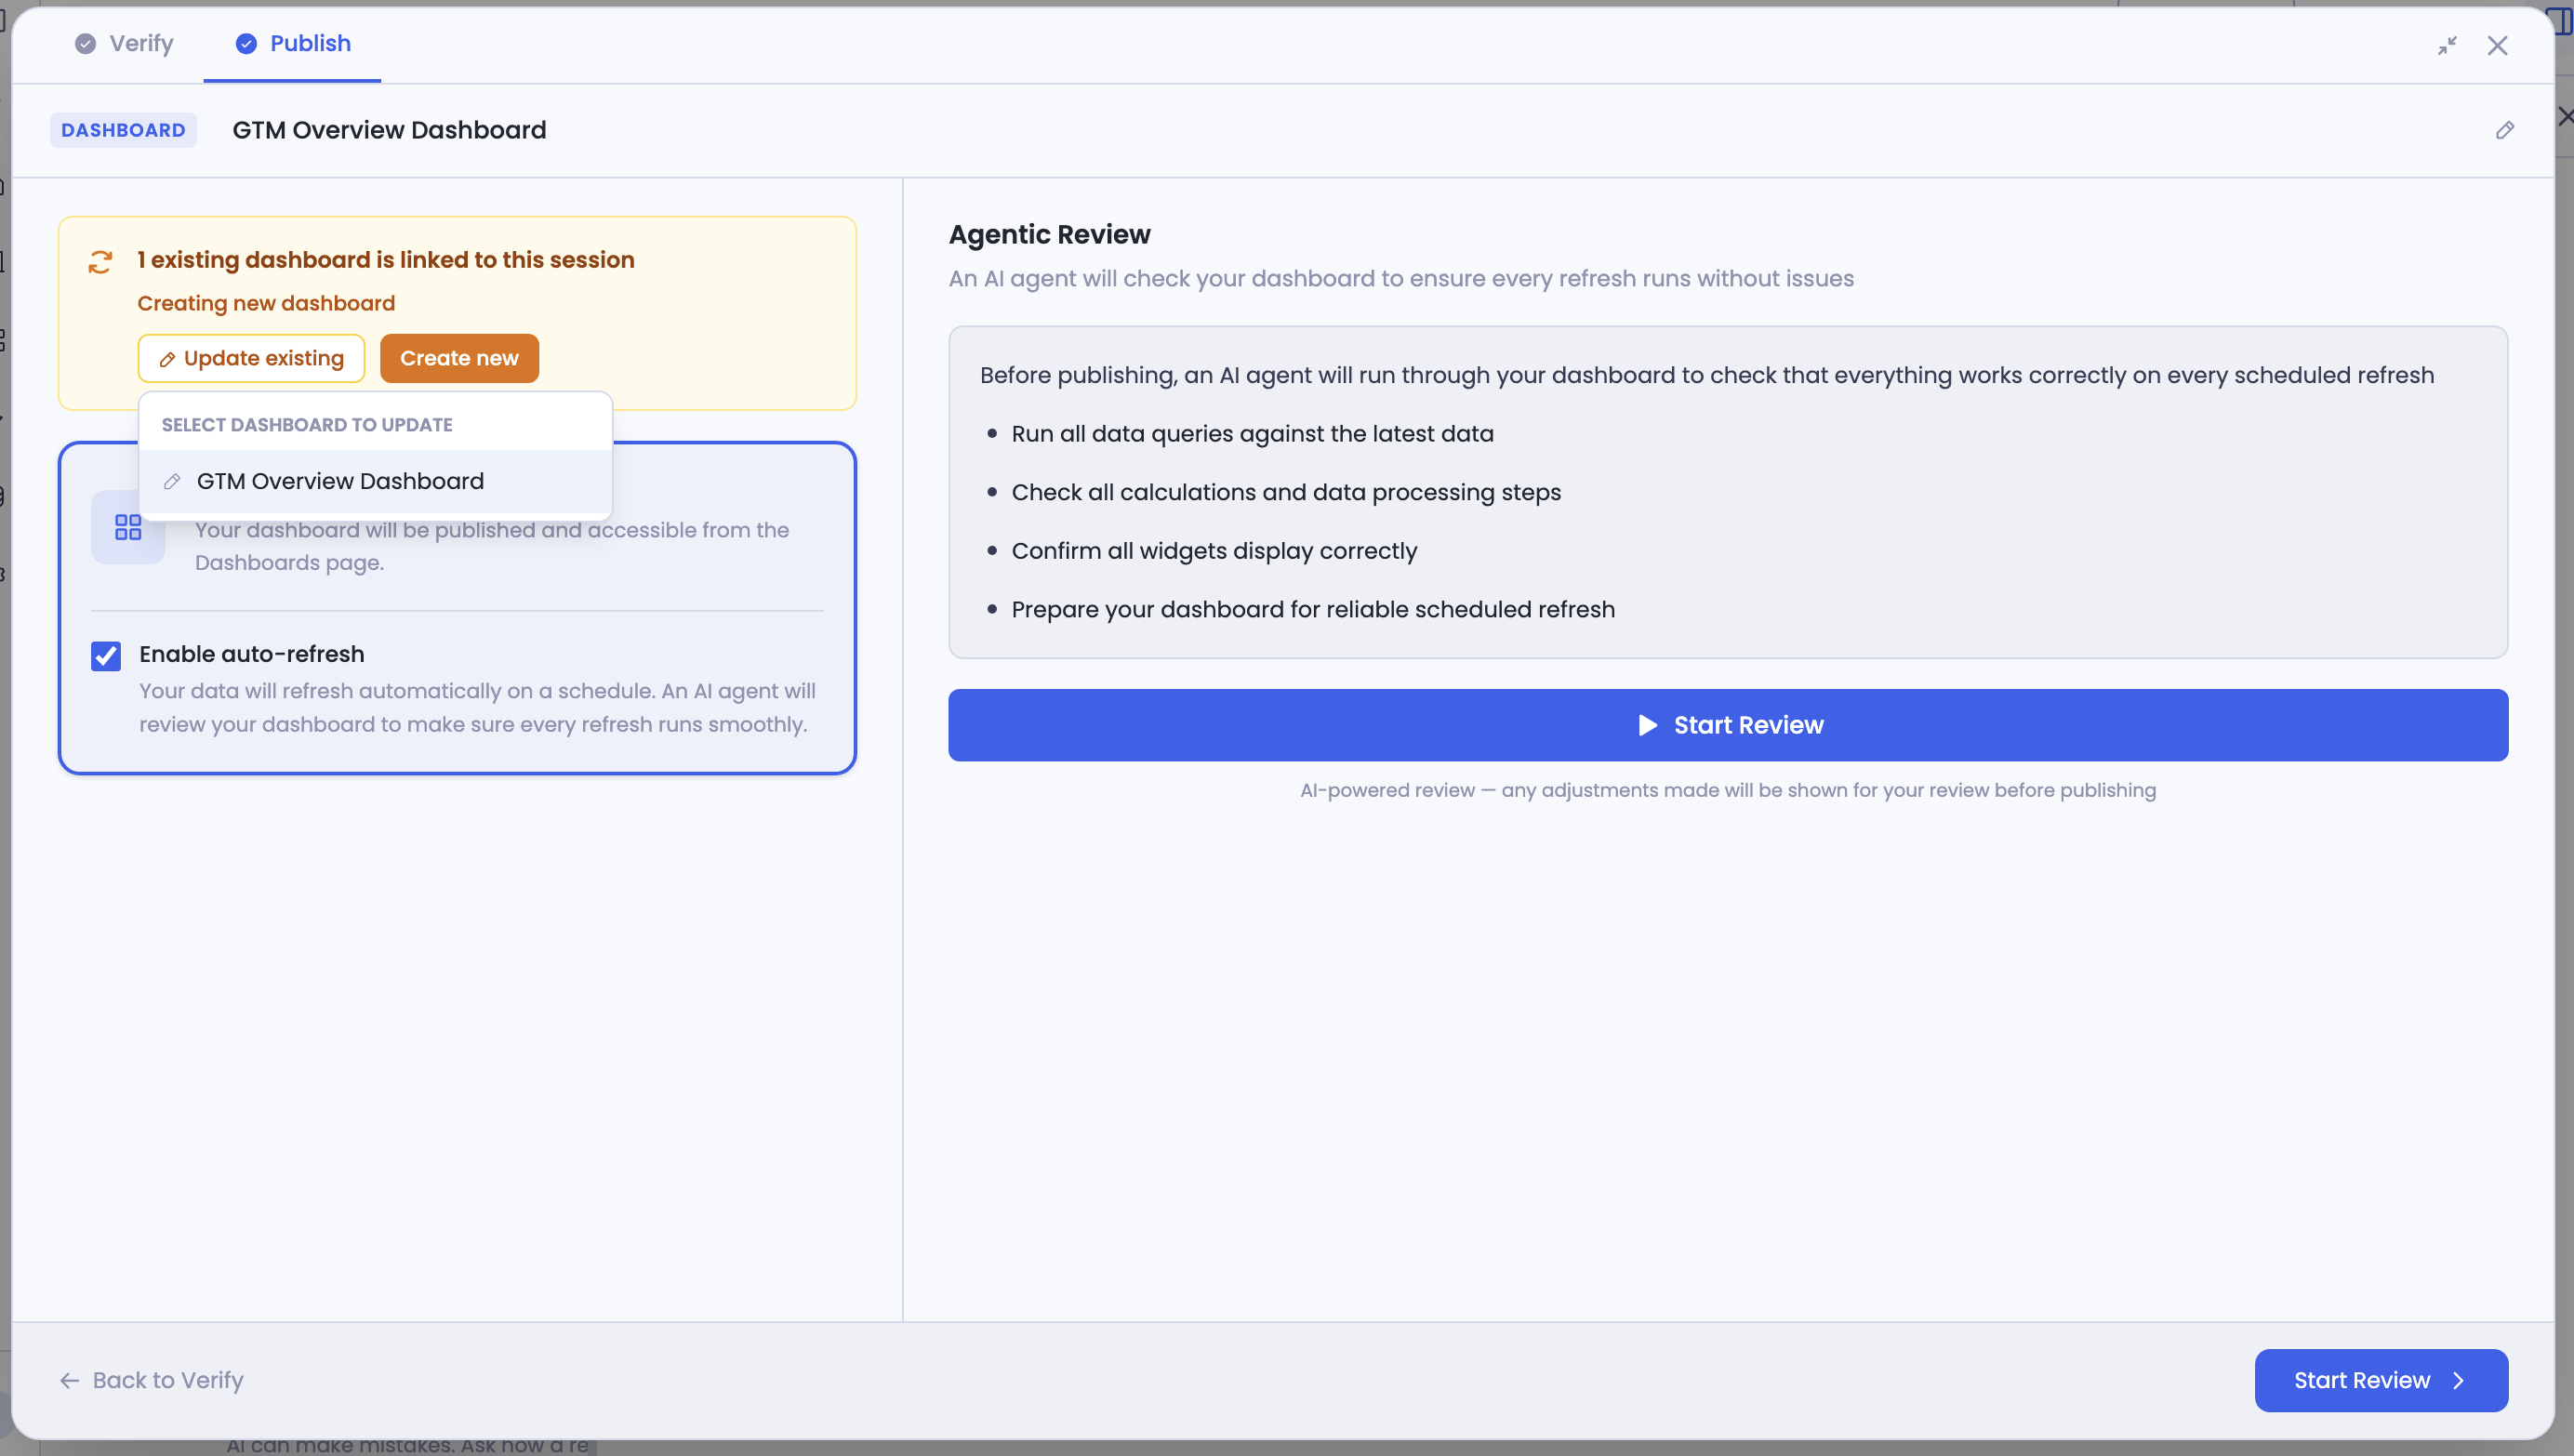
On the Publish page, you'll see dashboards already linked to this session. This is where you choose:
- Update an existing dashboard — select the specific dashboard you want to apply your changes to. The AI re-extracts the recipe from your updated chat session and attaches it to that dashboard.
- Create a new dashboard — publish this as a separate dashboard. The original dashboard and its recipe remain completely untouched — the new dashboard gets its own recipe based on the current state of the chat session.
A note on maintaining multiple dashboards: If you create a new dashboard from the same session, you now have two dashboards with two separate recipes. Since edits happen through the chat session, updating one dashboard in the future means the other won't reflect those changes automatically. If you plan to maintain and update both dashboards independently going forward, we recommend keeping a dedicated chat session for each dashboard. Session cloning to make this easier is a planned feature.
A few things to be mindful of:
- The Publish page defaults to "Create new dashboard." Every time you arrive at this page — especially if you've gone back to Verify and returned — check this selection.
- If multiple dashboards are linked to this session, be deliberate about which one you select for update.
- Check whether auto-refresh is set the way you want it — the setting may not carry over from your previous publish.
- The button currently says "Verify & Publish" whether you're creating or updating. We have improvements planned to make this distinction clearer.
Creating a Variation
Want a version of your dashboard with different filters, a different time range, or a subset of widgets?
- Go to the Dashboards page, find the original dashboard, and click Source Session
- Make your changes in the conversation
- Go to Verify & Publish. On the Publish page, choose Create new dashboard instead of updating the existing one
Your original dashboard stays untouched. The new one publishes as a separate dashboard.
Keep in Mind
Getting the best results from the AI
The AI workspace supports multiple types of output — dashboards, charts, reports, ad hoc analysis. Because of this flexibility, being specific in your prompts helps the AI understand exactly what you're looking for. For example, if you want a dashboard, mention "dashboard" in your request. If you want a one-time analysis or a summary report, say that. The more clearly you describe the output you have in mind, the faster the AI gets there — just like working with a new colleague who's sharp but still learning your vocabulary. A little back-and-forth in the early conversations is completely normal and part of the process.
Giving feedback on adjustments
The feedback chat on the adjustments page is specifically for the changes the AI made to prepare your dashboard for refresh. If a calculation looks wrong, a value seems off, or you want an adjustment handled differently — type your feedback, the AI re-processes the relevant step, and the adjustment updates. For changes to the dashboard itself — adding widgets, changing data sources, modifying layout — go back to the chat session.
Checking steps the AI didn't adjust
The adjustments page only shows steps the agent changed. If you want to review other steps — data queries, calculations, the full pipeline logic — go back to the Verify page. Each widget's "How it's built" panel shows the complete breakdown. You can then return to the Publish page to give feedback or continue with publishing.
When you go back to the Verify page from Publish and then return, remember to re-check your Publish page settings — which dashboard you're updating (or if you're creating new), and whether auto-refresh is enabled.
The preparation phase takes time
The AI reviews every step that goes into your dashboard. More steps means more time — this can take a few minutes for complex dashboards. You don't have to wait. You can close the page or navigate away, and the process continues in the background.
If you close or refresh during the review
Nothing is lost. The system keeps running in the background. When you return, you'll see the completed results. The progress view won't resume live from where you left — you'll see the final state instead.
We're building this with you
This is an early release and we're actively improving the experience. We've already planned UX improvements for the edit and navigation flows in upcoming releases. Your feedback directly shapes what we prioritize — the sooner you share it, the faster we can act on it.
What's Coming Next
The dashboard you're creating today is the first of several output types that will work through this same AI workspace. We're building toward a system where the same underlying data pipeline powers multiple outputs:
AI-generated summary reports — the AI interprets your data across runs, compares current performance against previous periods, identifies what changed and why, and produces a narrative report you can share with stakeholders
Alerts — set up scheduled checks or specific conditions on your data. Get notified via email or Slack when something changes or crosses a threshold you care about
Multi-channel delivery — share dashboards, reports, and alerts across email, Slack, and other channels your team uses
All of this builds on the same foundation you're using today — the same AI workspace, the same data connections, the same review and publish process.
Getting Help
If you have questions, run into issues, or want to share feedback on the experience, reach out to us directly at support@petavue.com. We're available and responsive — this is a collaborative process and your input matters.